This chapter is intended for anyone debugging Dynamic C programs. For the person with little to no experience, we offer general debugging strategies in Section 6.4. Both experienced and inexperienced Dynamic C users can refer to Section 6.2 to see the full set of tools, programs and functions available for debugging Dynamic C programs. Section 6.3 consolidates the information found in the GUI chapter regarding debugging features into an quicker-to-read table of GUI options. And lastly, Section 6.5 gives some good references for further study.
Dynamic C comes with robust capabilities to make debugging faster and easier. The debugger is highly configurable; it is easy to enable or disable the debugger features using the Project Options dialog.
The following Dynamic C debugging features are summarized here, with links given to more detailed descriptions.
printf() - Display messages to the Stdio window (default) or redirect to a serial port. May also write to a file.
Software Breakpoints - Stop execution, allow the available debug windows to be examined: Stack, Assembly, Dump and Register windows are always available.
Hardware Breakpoints - The Run menu item “Add/Edit Hardware Breakpoints” lets you set up to six hardware breakpoints on instruction fetches, data reads, and data writes. Note that a hardware breakpoint is not the same as a hard breakpoint. (Support for hardware breakpoints was added in Dynamic C 10.21.)
Single Stepping - Execute one C statement or one assembly statement. This is an extension of breakpoints, so again, the Stack, Assembly, Dump and Register windows are always available.
Watch Expressions - Keep running track of any valid C expression in the application. Fly-over hints evaluate any watchable statement.
Memory Dump - Displays blocks of raw values and their ASCII representation at any memory location (can also be sent to a file).
MAP File - Shows a global view of the program: memory usage, mapping of functions, global/static data, parameters and local auto variables, macro listing and a function call graph.
Assert Macro - This is a preventative measure, a kind of defensive programming that can be used to check assumptions before they are used in the code.
Blinking Lights - LEDs can be toggled to indicate a variety of conditions. This requires a signal line connected to an LED on the board.
Symbolic Stack Trace - Helps customers find out the path of the program at each single step or break point. By looking through the stack, it is possible to reconstruct the path and allow the customer to easily move backwards in the current call tree to get a better feeling for the current debugging context.
Persistent Breakpoints - Persistent breakpoints mean the information is retained when transitioning back and forth from edit mode to debug mode and when a file is closed and re-opened.
Enhanced Watch Expressions - The Watches window is now a tree structure capable of showing struct members. That is, all members of a structure become viewable as watch expressions when a structure is added, without having to add them each separately.
Enhanced Memory Dumps - Changed data in the Memory Dump window is highlighted in reverse video or in customizable colors every time you single step in either C or assembly.
Enhanced Mode Switching - Debug mode can be entered without a recompile and download. If the contents of the debugged program are edited, Dynamic C prompts for a recompile.
Enhanced Stdio Window - The Stdio window is directly searchable.
This section describes the different tools available for debugging, including their pros and cons, as well as when you might want to use them, how to use them and an example of using them. The examples are suggestions and are not meant to be restrictive. While there may be some collaboration, bug hunting is largely a solitary sport, with different people using different tools and methods to solve the same problem.
The printf() function has always been available in Dynamic C, with output going to the Stdio window by default, and optionally to a file (by configuring the Stdio window contents to log to a file). There is also the ability to redirect output to any one of the available serial ports A, B, C, D, E or F. See Samples\stdio_serial.c for instructions on how to use the serial port redirect. This feature is intended for debug purposes only.
The syntax for printf() is explained in detail in the Dynamic C Function Reference Manual, including a listing of allowable conversion characters.
Pros
A printf() statement is quick, easy and sometimes all that is needed to nail down a problem.
You can use #ifdef directives to create levels of debugging information that can be conditionally compiled using macro definitions. This is a technique used by Rabbit engineers when developing Dynamic C libraries. In the library code you will see statements such as:
#ifdef LIBNAME_DEBUG
printf(“Insert information here.\n”);
...
#endif
...
#ifdef LIBNAME_VERBOSE
printf(“Insert more information.\n”);
...
#endif
By defining the above mentioned macro(s) you include the corresponding printf statements.
Cons
The printf() function is so easy to use, it is easy to overuse. This can lead to a shortage of root memory. A solution to this that allows you to still have lots of printf strings is to place the strings in extended memory (xmem) using the keyword xdata and then call printf() with the conversion character “%ls.” An overuse of printf statements can also affect execution time.
Uses
Use to check a program’s flow without stopping its execution.
Example
There are numerous examples of using printf() in the programs provided in the Samples folder where you installed Dynamic C.
To display a string to the Stdio window place the following line of code in your application:
printf("Entering my_function().\n");
To do the same thing, but without using root memory:
xdata entering {“Entering my_function().”};
...
printf("%ls\n", entering);
Dynamic C's STDIO window supports the following small subset of the so-called "ANSI Escape Sequences" as described originally in the ANSI X3.64 standard (withdrawn), ISO/IEC 6429 and ECMA-48 (fourth edition):
ESC [ n A
Cursor up n lines.
ESC [ n B
Cursor down n lines.
ESC [ n C
Cursor forward n columns.
ESC [ n D
Cursor backward n columns.
ESC [ y ; x H
Move cursor to row y, column x. Values start at 1.
ESC [ 2 J
Clear the entire screen & move to home position (n=2).
ESC [ K
Clear to end of line.
ESC [ n m
Reset attributes (n=0) or set attribute n.
0 = reset
Colors: 0 = black
7 = reverse (white on black)
1 = red
8 = concealed (white on white)
2 = green
30 + Color = foreground color
3 = yellow
40 + Color = background color
4 = blue
5 = magenta
6 = cyan
7 = white
9 = reset
Note: A semicolon-separated attributes list is supported (e.g. ESC [ n1 ; n2 ; … m).
ESC [ s
Save cursor position.
ESC [ u
Restore cursor position.
For a colorful example of using ANSI escape sequences in Dynamic C's STDIO window, please run the Samples\enum.c standard sample program.
Software breakpoints are versatile. There is the ability to set breakpoints in ISRs, the existence of persistent breakpoints and the ability to set breakpoints in edit mode. There is also a “Clear All Breakpoints” command. Dynamic C 10.21 changes the keyboard shortcut for clearing all software breakpoints from Ctrl+A to Ctrl+B.
Pros
Software breakpoints can be set on any C statement unless it is marked “nodebug” and in any “#asm debug” assembly block. This includes code in library files. Breakpoints let you run a program at full speed until the specified stopping point is reached. You can set multiple breakpoints in a program or even on the same line. They are easy to toggle on and off individually and can all be cleared with one command. You can choose whether to leave interrupts turned on (soft breakpoint) or not (hard breakpoint).
When stopped at a breakpoint, you can examine up-to-date contents in debug windows and choose other debugging features to employ, such as single stepping, dumping memory, fly-over watch expressions.
Cons
To support large sector flash, breakpoint internals require that breakpoint overhead remain, even when the breakpoint has been toggled off. Recompile the program to remove this overhead.
When the debug keyword is added to an assembly block, relative jumps (which are limited to 128 bytes) may go out of range. If this happens, change the JR instruction to a JP instruction. Another solution is to embed a null C statement in the assembly code like so:
#asm
...
c ; // Set a breakpoint on the semicolon
...
#endasm
Uses
Use software breakpoints when you need to stop at a specified location to begin single stepping or to examine variables, memory locations or register values.
Example
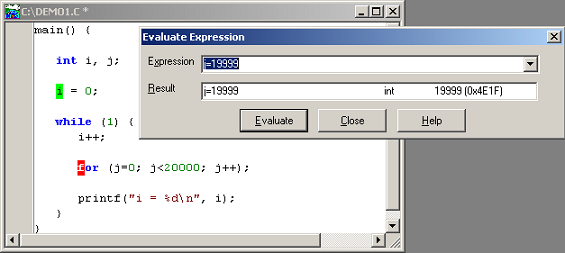
Open Samples\Demo1.c. Press F5 to compile the program, then place the cursor on the word “for” and press F2 to insert a breakpoint. Now press F9. Every time you press F9 program execution will stop when it hits the start of the for loop. From here you can single step or look at a variety of information through debug windows.
For example, say there is a problem when you get to the limit of a for loop. You can use the “Evaluate Expressions” dialog to set the looping variable to a value that brings program execution to the exact spot that you want, as shown in this screenshot:
Figure 6.1 Altering the Looping Variable when Stopped at a Breakpoint
The Rabbit processor has seven hardware breakpoints. Dynamic C 10.21 introduced support for this processor feature. One of the seven hardware breakpoints is used by the debug kernel. The remaining six hardware breakpoints may be configured by selecting the “Add | Edit Hardware Breakpoints” item from the Run menu.
Pros
Hardware breakpoints can be set on any instruction fetch or any data read or write, this includes code marked as “nodebug”. You can set multiple breakpoints in a program.
When stopped at a breakpoint, you can examine up-to-date contents in debug windows and choose other debugging features to employ, such as single stepping, dumping memory, and fly-over watch expressions.
Cons
Hardware breakpoints are more time-consuming to configure than software breakpoints. You must know the address where you wish to stop and also whether the access is for data or code.
Uses
Allows greater access to “nodebug” Dynamic C library code during program execution. Offers increased knowledge when tracking hard to debug memory corruption errors.
The “Mask” text box in the “Add/Edit Hardware breakpoints” dialog lets you specify “don’t care” digits in the address, thus using a single breakpoint address to set a range of addresses that will trigger the breakpoint.
Example
The debug windows make configuring a hardware breakpoint straightforward. For instance, the Assembly window lists an address for each instruction, so breaking on an instruction fetch is just a matter of finding the instruction in the Assembly window and typing its address into the hardware breakpoint dialog box, as shown in the screen shot below of Demo1.c.
Table 6-1. Samples\Demo1.c
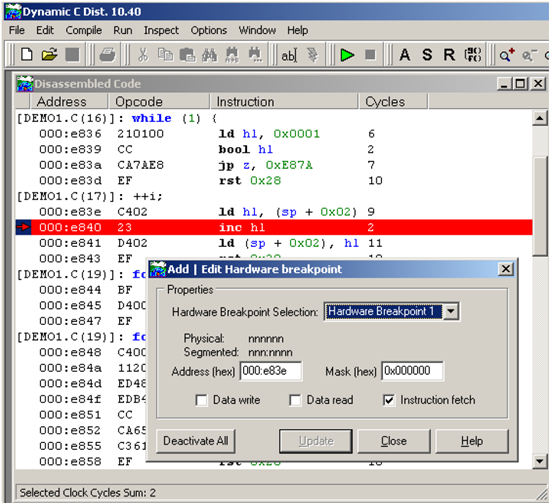
Hardware breakpoints cause the processor to stop at the address logically after the break address specified, thus “Hardware Breakpoint 1” is set for 000:e83e, but program execution stopped at 000:e840. The PC was incremented twice for the 2-byte opcode of the “ld” instruction. For an instruction fetch breakpoint, the processor will stop after executing the instruction at the breakpoint address.
In addition to debug windows, the MAP File can be used to find out addresses for code and data. The map file is a rich source of memory mapping information, listing everything from local variables to the origin and size of code and data segments.
Setting a hardware breakpoint on some internal I/O addresses can lead to a target communication error. Since setting a breakpoint mask to 0xffffff will include all internal I/O address, the address and mask should be set to include only the intended range of addresses.
Starting with Dynamic C 10.54, hardware breakpoints are disabled when code is executing within the debug kernel.
Single stepping can be a very useful debugging technique.
Pros
Single stepping allows you to closely supervise program execution at the source code level, either by C statement or assembly statement. This helps in tracing the logic of the program. You can single step any debuggable statement. Even Dynamic C library functions can be stepped into as long as they are not flagged as nodebug.
Cons
Single stepping is of limited use if interaction with an external device is being examined; an external device does not stop whatever it is doing just because the execution of the application has been restrained.
Also, single stepping can be very tedious if stepping through many instructions. Well-placed breakpoints might serve you better.
Uses
Single stepping is typically used when you have isolated the problem and have stopped at the area of interest using a breakpoint.
Example
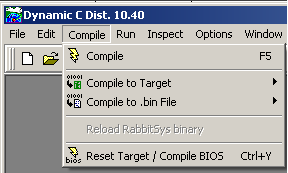
To single step through a program instead of running at full execution speed, compile the program without running it.
To compile the program without running it, use the Compile menu option, the keyboard shortcut F5 or the toolbar menu button (pictured to the left of the Compile menu option).
F7, F8, Alt+F7 and Alt+F8 are the keyboard shortcuts for stepping through code. Use F7 if you want to step at the C statement level, but want to step into calls to debuggable functions. Use F8 instead if you want to step over function calls.
If the Assembly window is open, the stepping will be done by assembly instruction instead of by C statement if the feature “Enable instruction level single stepping” is checked on the Debugger tab of the Project Options dialog; otherwise, stepping is done by C statement regardless of the status of the Assembly window. If you have checked “Enable instruction level single stepping” but wish to continue to step by C statement when the Assembly window is open, use Alt+F7 or Alt+F8 instead of F7 or F8.
The watch expressions feature applies to any valid C expression. It is possible to evaluate watchable expressions using flyover hints. (The highlighted expression does not need to be set as a watch expression for evaluation in a flyover hint.) When a structure is set as a watch expression, all of its memebers are set automatically as watch expressions.
Pros
Any valid C expression can be watched. Multiple expressions can be watched simultaneously. Once a watch is set on an expression, its value is updated in the Watches window whenever program execution is stopped.
The Watches window may be updated while the program is running (which will affect timing) by issuing the “Update Watch Window” command: use the Inspect menu, Ctrl+U or the toolbar menu button shown here to update the Watches window.
You can use flyover hints to find out the value of any highlighted C expression when the program is stopped.
Cons
The scope of variables in watch expressions affects the value that is displayed in the Watches window. If the variable goes out of scope, its true value will not be displayed until it comes back into scope.
Keep in mind two additional things, which are not bad per se, but could be if they are used carelessly: Assignment statements in a watch expression will change the value of a variable every time watches are evaluated. Similarly, when a function call is in a watch expression, the function will run every time watches are evaluated.
Uses
Use a watch expression when the value of the expression is important to the behavior of the part of the program you are analyzing.
Example
Watch expressions can be used to evaluate complicated conditionals. A quick way to see this is to run the program Samples\pong.c. Set a breakpoint at this line
if (nx <= xl || nx >= xh)
within the function pong(). While the program is stopped, highlight the section of the expression you want evaluated. Use the watches flyover hint by hovering the cursor over the highlighted expression. It will be evaluated and the result displayed. You can see the values of, e.g., nx or x1 or the result of the conditional expression nx <= x1, depending on what you highlight.
Keep in mind that when single stepping in assembly, the value of the watch expression may not be valid for variables located on the stack (all auto variables). This is because the debug kernel does not keep track of the pushes and pops that occur on the stack, and since watches of stack variables only make sense in the context of the pushes and pops that have happened, they will not always be accurate when assembly code is being single stepped.
The evaluate expression functionality is a special case of a watch expression evaluation in that the evaluation takes place once, when the Evaluate button is clicked, not every time the Watches window is updated.
Pros
Like watches, you can use the Evaluate Expression feature on any valid C expression. Multiple Evaluate Expression dialogs can be opened simultaneously.
Cons
Can alter program data adversely if the change being made is not thought out properly
Uses
This feature can be used to quickly and easily explore a variant of program flow.
Example
Say you have an application that is supposed to treat the 100th iteration of a loop as a special case, but it does not. You do not want to set a breakpoint on the looping statement and hit F9 that many times, so instead you force the loop variable to equal 99 using the evaluate expression dialog. To do this compile the program without running it. Set a breakpoint at the start of the loop and then single step to get past the loop variable initialization. Open the Inspect menu and choose Evaluate Expression. Type in “j=99” and click on the Evaluate button. Now you are ready to start examining the program’s behavior.
The Dump window is a versatile tool. For example, multiple dump windows can be active simultaneously, flyover hints make it easier to see the correct address, and three different types of dumps are allowed. Read the section titled, “Debugging Tools” for more information on these topics. Another useful feature of the Dump window is that values that have changed are shown highlighted in reverse video or in customizable colors.
Pros
Dump windows allow access to any memory location, beginning at any address. There are alignment options; the data can be viewed as bytes, words or double-words using a right-click menu.
Cons
The Dump window does not contain symbolic information, which makes some information harder to decipher. There is the potential for increased debugging overhead if you open multiple dump windows and make them large.
Uses
Use a dump window when you suspect memory is being corrupted or to watch string or numerical data manipulation proceed. String manipulation can easily cause memory corruption if you are not careful.
Example
Consider the following code:
char my_array[10];
for (i=0; i<=10; i++){
my_array[i] = 0xff;
}
If you do not have run-time checking of array indices enabled, this code will corrupt whatever is immediately following my_array in memory.
There is no run-time checking for string manipulation, so if you wrote something like the following in your application, memory would be corrupted when the null terminator for the string “1234” was written.
void foo () {
int x;
char str[4];
x = 0xffff;
strcpy(str,”1234”);
}
Watching changes in a dump window will make the mistake more obvious in both of these situations, though in the former, turning on run-time checking for array indices in the Compiler tab of the Project Options dialog is easier.
Map files are always generated for compiled programs.
Pros
The map file is full of useful information. It contains:
location and size of code and data segments
a list of all symbols used, their location, size and file of origin
a list of all macros used, their file of origin and the line number within that file where the macro is defined
function call graph
A valid map file is produced after a successful compile, so it is available when a program crashes.
Cons
If the compile was not successful, for example you get a message that says you ran out of root code space, the map file will still be created, but will contain incomplete and possibly incorrect information.
Uses
Map files are useful when you want to gather more data or are trying to get a comprehensive overview of the program. A map file can help you make better use of memory in cases where you are running short or are experiencing stack overflow problems.
Example
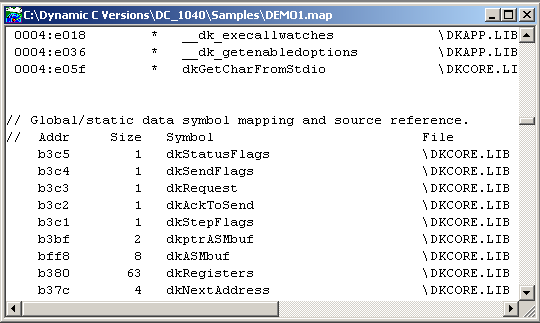
Say you are pushing the limits of memory in your application and want to see where you can shave bytes. The map file contains sizes for all the data used in your program. The screen shot below shows some code and part of its map file. Maybe you meant to type “200” as the size for my_array and added a zero on the end by mistake. (This is a good place to mention that using hard-coded values is more prone to error than defining and using constants.)
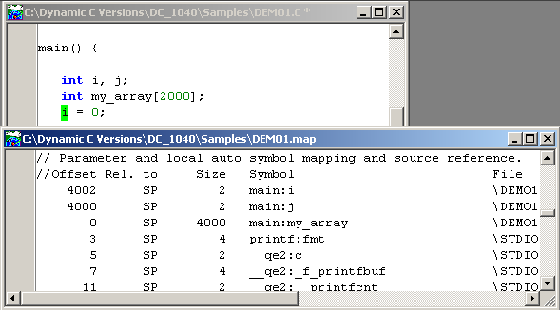
Scanning the size column, the mistake jumps out at you more readily than looking at the code, maybe because you expect to see “200” and so your brain filters out the extra zero. For whatever reason, looking at the same information in a different format allows you to see more.
The size value for functions might not be accurate because it measures code distance. In other words, if a function spans a gap created with a follows action, the size reported for the function will be much greater than the actual number of bytes added to the program. The follows action is an advanced topic related to the subject of origin directives. See the Rabbit 4000 Designer’s Handbook for a discussion of origin directives and action qualifiers.
The map file provides the logical and physical addresses of the program and its data. The screen shot below shows a small section of demo1.map. The left-most column shows line numbers, with addresses to their immediate right. Using the addresses we can reproduce the actions taken by the Memory Management Unit (MMU) of the Rabbit. Addresses with four digits are both the logical and the physical address. That is because in the logical address space they are in the base segment, which always starts at zero in the physical address space. You can see this for yourself by opening two dump windows: one with a four-digit logical address and the second with that same four-digit number but with a leading zero, making it a physical address. The contents of the dump windows will be the same.
The addresses in the format xx:yyyy are physical addresses. For code xx is the XPC value, for data it is the value of DATASEG; yyyy is the PC value for both code and data. In the above map file you can see examples of both code and data addresses. Addresses in the format xx:yyyy are transformed by the MMU into 5-digit physical addresses.
We will use the address fa:e64c to explain the actions of the MMU. It is really very simple if you can do hex arithmetic in your head or have a decent calculator. The MMU takes the XPC or DATASEG value, appends three zeros to it, then adds it to the PC value, like so:
fa000 + e64c = 10864c
A sixth digit in the result is ignored, leaving us with the value 0x0864c. This is the physical address. Again, you can check this in a couple of dump windows by typing in the 5-digit physical address for one window and the XPC:offset into another and seeing that the contents are the same.
Dynamic C has both a Stack window and a Stack Trace window. The Stack window lets you view the top 32 bytes of the stack. The Stack Trace window lets you see where you are and how you got there. It keeps a running depth value, telling you how many bytes have been pushed on the stack in the current program instance, or since the depth value reset button was clicked. The Stack Trace window only tracks stack-based variables, i.e., auto variables. The storage class for local variables can be either auto or static, specified through a modifier when the variable is declared or globally via the #class directive. Whatever the means, if a local variable is marked static it will not appear in the Stack Trace window.
Pros
Provides a concise history of the call sequence and values of local variables and function arguments that led to the current breakpoint, all for a very small cost in execution time and BIOS memory.
Cons
Currently, the Stack Trace window can not trace the parameters and local variables in cofunctions. Also the contents of the window can not be saved after a program crash.
Uses
Use stack tracing to capture the call sequence leading to a breakpoint and to see the values of functions arguments and local variables.
Example
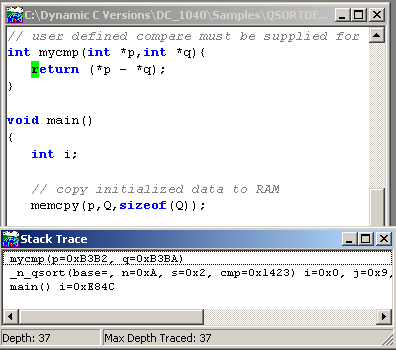
Say you have a function that is behaving badly. You can set a breakpoint in the function and use the Stack Trace window to examine the function call sequence. Examining the call sequence and the parameters being passed might give enough information to solve the problem.
The following screenshot shows an instance of qsortdemo.c and the Stack Trace window. Note that the call to memcpy() is not represented on the stack. The reason is that its stack activity had completed and program execution had returned to main() when the stack was traced at the breakpoint in the function mycmp().
The Dynamic C implementation of assert follows the ANSI standard for the NDEBUG macro, but differs in what the macro is defined to be so as to save code space (ANSI specifies that assert is defined as ((void)0) when NDEBUG is defined, but this generates a NOP in Dynamic C, so it is defined to be nothing).
Pros
The assert macro is self-checking software. It lets you explicitly state something is true, and if it turns out to be false, the program terminates with an error message. At the time of this writing, this link contained an excellent write-up on the assert macro:
http://www.embedded.com/story/OEG20010311S0021
Cons
Side effects can occur if the assert macro is not coded properly, e.g.,
assert(i=1)
will never trigger the assert and will change the value of the variable i; it should be coded as:
assert(i==1)
Uses
Use the assert macro when you must make sure your assumption is accurate.
Example
Check for a NULL pointer before using it.
void my_function (int * ptr){
assert(ptr);
...
}
Noted here are a number of other debugging tools to consider.
General Debug Windows
In addition to the debug windows we have discussed already, there are three other windows that are available when a program is compiled: the Assembly, Register and Stack windows. They are described in detail in Chapter 16 , in the sections titled, Assembly (F10), Register Window and Stack (F12), respectively.
xalloc_stats()
Prints a table of physical addresses that are available for allocation in xmem via xalloc() calls. To display this information in the Stdio window, execute the statement:
xalloc_stats(0);
in your application or use Inspect | Evaluate Expression. The Stdio window will display something similar to the following:
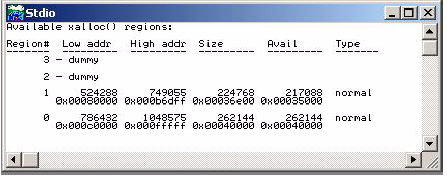
A region is a contiguous piece of memory. Theoretically, up to four regions can exist; a region that is marked “dummy” is a region that does not exist. Each region is identified as “normal” or “BB RAM,” which refers to memory that is battery-backed.
SerialIO.exe
The utility serialIO.exe is located in \Diagnostics\Serial_IO. It is also in the file SerialIO_1.zip, available for download at: www.rabbit.com/support/downloads/.
This utility is a specialized terminal emulator program and comes with several diagnostic programs. The diagnostic programs test a variety of functionality, and allow the user to simulate some of the behavior of the Dynamic C download process.
The utility has a Help button that gives complete instructions for its use. The Rabbit 4000 Designer’s Handbook in the chapter titled “Troubleshooting Tips for New Rabbit-Based Systems” explains some of the diagnostic programs that come with the serialIO utility. Understanding the information in this chapter will allow you to write your own diagnostic programs for the serialIO utility.
reset_demo.c
The sample program Samples\reset_demo.c demonstrates using the functions that check the reason for a reset: hard reset (power failure or pressing the reset button), soft reset (initiated by software), or a watchdog timeout.
Error Logging
Chapter 9, “Run-Time Errors,” describes the exception handling routine for run-time errors that is supplied with Dynamic C. The default handler may be replaced with a user-defined handler. Also error logging can be enabled by setting ENABLE_ERROR_LOGGING to 1 in ERRLOGCONFIG.LIB. Error logging is no longer supported as of Dynamic C 10.40.
Watchdogs
Ten virtual watchdogs are provided, in addition to the hardware watchdog(s) of the processor. Watchdogs, whether hardware or software, limit the amount of time a system is in an unknown state.
Virtual watchdogs are maintained by the Virtual Driver and described in Section 7.4.2. The sample program Samples\VDRIVER\VIRT_WD.C demonstrates the use of a virtual watchdog.
Compiler Options
The Compiler tab of the Project Options dialog contains several options that assist debugging. They are summarized here and fully documented starting on page 282.
List Files - When enabled, this option generates an assembly list file for each compile. The list file contains the same information and is in the same format as the contents of the Assembly window. List files can be very large.
Run-Time Checking - Run-time checking of array indices and pointers are enabled by default. Run-time pointer checking is no longer available as of Dynamic C 10.50.
Type Checking - Compile-time checking of type options are enabled by default. There are three type checking options, labeled as: Prototype, Demotion and Pointer. Checking prototypes means that arguments passed in function calls are checked against the function prototype. Demotion checking means that the automatic conversion of a type to a smaller or less complex type is noted. Pointer checking refers to making sure pointers of different types being intermixed are cast properly.
See the section titled, “Type Checking” on page 283 for more information.
Debugging software by toggling LEDs on and off might seem like a strange way to approach the problem, but there are a number of situations that might call for it. Maybe you just want to exercise the board hardware. Or, let us say you need to see if a certain piece of code was executed, but the board is disconnected from your computer and so you have no way of viewing printf output or using the other debugging tools. Or, maybe timing is an issue and directly toggling an LED with a call to WrPortE() or BitWrPortE() gives you the information you need without as much affect on timing.
Debugger features are accessed from several different Dynamic C menus. The menu to look in depends on whether you want to enable, configure, view or use the debugger feature. This section identifies the various menus that deal with debugging. Table 6-2 summarizes the menus and debugging tools.
|
Name of Feature |
Where Feature is Configured |
Where Feature is Enabled |
Where Feature is ToggledA |
|
Symbolic Stack Trace |
Environment Options, |
Project Options, |
Windows Menu |
|
Software Breakpoints |
Project Options, |
Project Options, |
Run Menu |
|
Hardware Breakpoints |
“Add | Edit Hardware breakpoint” dialog |
Run menu’s “Add/Edit Hardware Breakpoints” option |
In “Add | Edit Hardware breakpoint” dialog, change check box, then click “Update” button |
|
Single Stepping |
No configuration options |
Always enabled |
Run Menu |
|
Instruction Level Single Stepping |
No configuration options |
Project Options, |
Run Menu |
|
Watch Expressions |
Environment Options, Project Options, |
Project Options, |
Inspect Menu |
|
Evaluate Expression |
No configuration options |
This feature is enabled when Watch Expressions is enabled. |
Inspect Menu |
|
Map File |
No configuration options |
Always enabled |
Automatically generated for compiled programs |
|
Memory Dump |
Environment Options, |
Always enabled |
Inspect Menu |
|
Disassemble Code |
Environment Options, |
Always enabled |
Inspect Menu |
|
Assert Macro |
Programatically |
Programatically |
Programatically |
|
printf() |
Programatically |
Programatically |
Programatically |
|
Stdio, Stack and Register windows |
Environment Options, |
Always enabled |
Windows Menu |
|
AKeyboard shortcuts and toolbar menu buttons are shown along with their corresponding menu commands in the dropdown menus. |
The Run and Inspect menus are covered in detail in Section 16.5 and Section 16.6, respectively. These menus are where you can enable the use of several debugger features. The Run menu has options for toggling breakpoints and for single stepping. The Inspect menu has options for manipulating watch expressions, disassembling code and for dumping memory. For the most part, a debugger feature must be enabled before it can be selected in the Run or Inspect menus (or by its keyboard shortcut or toolbar menu button). Most debugger features are enabled by default in the Project Options dialog. The disassembled code and memory dump options are the exception, as they are always available to a compiled program.
From the Options menu in Dynamic C you can select Environment Options, Project Options or Toolbars, where you configure debug windows, enable debug tools or customize your toolbar buttons, respectively.
The Environment Options dialog has a tab labeled “Debug Windows.” There are a number of configuration options available there. You can choose to have all or certain debug windows open automatically when a program compiles. You can choose font and color schemes for any debug window. More important than fonts and colors, you can configure most of the debug windows in ways specific to that window. For example, for the Assembly window you can alter which information fields are visible. See the section titled, “Debug Windows Tab” on page 272 for complete information on the specific options available for each window.
The Project Options dialog has a tab labeled “Debugger.” This is where symbolic stack tracing, breakpoints, watch expressions and instruction level single stepping are enabled. These debugging tools must be enabled before they can be used. Some configuration options are also set on the Debugger tab. See the section titled, “Debugger Tab” on page 288, for complete information on the configuration options available on the Debugger tab.
The final menu selection on the Options menu is labeled, “Toolbars.” This is where you choose the toolbars and the menu buttons that appear on the control bar. See the section titled, “Toolbars” on page 294, for instructions on customizing this area. Placing the menu buttons you use the most on the control bar is not really a debugging tool, but may make the task easier by offering some convenience.
The Window menu is where you can toggle display of debug windows. See Section 16.8 for more information. Another selection available from the Window menu is the Information window, which contains memory information and the status of the last compile. See “Information” on page 301 for full details.
Since bug-free code is a trade-off with time and money, we know that software has bugsi. This section discusses ways to minimize the occurrence of bugs and gives you some strategies for finding and eliminating them when they do occur.
There is a big difference between “buggy code” and code that runs with near flawless precision. The latter program may have a bug, but it may be a relatively minor problem that only appears under abnormal circumstances. (This touches on the subject of testing, which are the actions taken specifically to find bugs, a larger discussion that is beyond the scope of this chapter.) This section discusses some time-tested methods that may improve your ability to write software with fewer bugs.
The Design: The design is the solution to the problem that a program or function is supposed to solve. At a high level, the design is independent of the language that will be used in the implementation. Many questions must be asked and answered. What are the requirements, the boundaries, the special cases? These things are all captured in a well thought out design document. The design, written down, not just an idea floating in your head, should be rigorous, complete and detailed. There should be agreement and sign-off on the design before any coding takes place. The design underlies the code—it must come first. This is also the first part of creating full documentation.
Documentation: Other documentation includes code comments and function description headers, which are specially formatted comments. Function description headers allow functions from libraries listed in lib.dir to be displayed in the Function Lookup option in Dynamic C’s Help menu (or by using the keyboard shortcut Ctrl+H). See Section 4.11 for details on creating function description headers for user-defined library functions.
Another way to comment code is by making the code self-documenting: Always choose descriptive names for functions, variables and macros. The brain only has so much memory capacity, and there is no need to waste it by requiring yourself to remember that cwl() is the function to call when you want to check the water level in your fish tank; chk_h20_level(), for example, makes it easier to remember the function’s purpose. Of course, you get very familiar with code while it is in development and so your brain transforms the letters “cwl” quite easily to the words “check water level.” But years later when some esoteric bug appears and you have to dig into old code, you might be glad you took the time to type out some longer function names.
Modular Code: If you have a function that checks the water level in the fish tank, don’t have the same function check the temperature. Keep functions focused and as simple as possible.
Coding Standards: The use of coding standards increases maintainability, portability and re-use of code. In Dynamic C libraries and sample programsii some of the standards are as follows:
Macros names are capitalized with an underscore separating words, e.g., MY_MACRO.
Function names start with a lowercase letter with an underscore or a capital letter separating words, e.g., my_function() or myFunction().
Use parenthesis. Do not assume everyone has memorized the rules of precedence. E.g.,
y = a * b << c; // this is legal
y = (a * b) << c; // but this is more clear
Use consistent indenting. This increases readability of the code. Look in the Editor tab in the Environment Options dialog to turn on a feature that makes this automatic.
Use block comments (/*...*/) only for multiple line comments on the global level and line comments (//) inside functions, unless you really need to insert a long, multiple line comment. The reason for this is it is difficult to temporarily comment out sections of code using /*...*/ when debugging if the section being commented out has block comments, since block comments are not nestable.
Use Dynamic C code templates to minimize syntax errors and some typos. Look in the Code Templates tab in the Environment Options dialog to modify existing templates or create you own. Right click in an editor window and select Insert Code Template from the popup menu. This will bring up a scroll box containing all the available templates from which to choose.
Syntax Highlighting: Many syntactic elements are visually enhanced with color or other text attributes by default. These elements are user-configurable from the Syntax Colors tab of the Environment Options dialog. This is more than mere lipstick. The visual representation of material can aid in or detract from understanding it, especially when the material is complex.
Revision Control System: If your company has a code revision control systems in place, use it. In addition, when in development or testing stages, keep a known good copy of your program close at hand. That is, a compiles-and-runs-without-crashing copy of your program. Then if you make changes, improvements or whatever and then can’t compile, you can go back to the known good copy.
When a program does not compile, or compiles, but when running behaves in unexpected ways, or perhaps worse, runs and then crashes, what do you do?
Compilation failures are caused by syntax errors. The compiler will generate messages to help you fix the problem. There may be a list of compiler error messages in the window that pops up. Fix the first one, then recompile. The other compile errors may disappear if they were not true syntax errors, but just the compiler being confused from the first syntax error.
During development, verify code as you progress. Develop code one function at a time. Do not wait until you are finished with your implementation before you attempt to compile and run it, unless it is a very short application. After a program is compiled, other types of bugs have a chance to reveal themselves. The rest of this section concentrates on how to find a bug.
Keep an open mind. It might not be a bug in the software: you might have a bad cable connection, or something along those lines. Check and eliminate the easy things first. If you are reasonably sure that your hardware is in good working order, then it is time to debug the software.
Some bugs are consistent and are easy to reproduce, which means it will be easier to gather the information needed to solve the problem. Other bugs are more elusive. They might seem random, happening only on Wednesdays, or some other seemingly bizarre behavior. There are a number of reasons why a bug may be intermittent. Here are some common one:
Memory corruption
uninitialized or incorrectly initialized pointers
buffer overflow
Stack overflow/underflow
ISR modifying but not saving infrequently used register
Interrupt latency
Other borderline timing issues
EMI
One of the difficulties of debugging is that the source of a bug and its effect may not appear closely related in the code. For example, if an array goes out of bounds and corrupts memory, it may not be a problem until much later when the corrupted memory is accessed.
After you can reproduce the bug, create the shortest program possible that demonstrates the problem. Whatever the size of the code you are debugging, one way to minimize the failure scenario is a method called “binary search.” Basically, comment out half the code (more or less) and see which half of the program the bug is in. Repeat until the problem is isolated.
Get out of your cubicle. It is a well-known fact that there are times when simply walking over to a co-worker and explaining your problem can result in a solution. Probably because it is a form of data gathering. The more data you gather (up to a point), the more you know, and the more you know, the more your chances of figuring out the problem increase.
Stay in your cubicle. Log on and get involved in one of the online communities. There is a great Yahoo E-group dedicated to Rabbit and Dynamic C. Although Rabbit engineers will answer questions there, it is mostly the members of this group that solve problems for each other. To join this group go to:
http://tech.groups.yahoo.com/group/rabbit-semi/
Another good online source of information and help is the Rabbit bulletin board. Go to:
If you are having trouble figuring out what is happening, remember to analyze the bug under various conditions. For example, run the program without the programming cable attached. Change the baud rate. Change the processor speed. Do bug symptoms change? If they do, you have more clues.
There are many good references available. Here are a few of them:
Debugging Embedded Microprocessor Systems, Stuart Ball
Writing Solid Code, by Steve Macquire
Websites: google, search on debugging software
At the time of this writing the following links provided some good information:
http://www.embeddedstar.com/technicalpapers/content/d/embedded1494.html
“They Write the Right Stuff” by Charles Fishman
http://www.fastcompany.com/online/06/writestuff.html
i. For an account of what can happen when time and money constraints all but disappear, read “They Write the Right Stuff” by Charles Fishman.
ii. Older libraries may not adhere strictly to these standards.