Dynamic C can be used to edit source files, compile and run programs, and choose options for these activities using pull-down menus or keyboard shortcuts. There are two modes: edit mode and run mode (run mode is also known as debug mode). Various debugging windows can be viewed in run mode. Programs can compile directly to a target controller for debugging in RAM or Flash. Programs can also be compiled to a .bin file, with or without a controller connected to the PC.
To debug a program, a controller must be connected to the PC, either directly via a programming cable or indirectly via an Ethernet connection while using either a RabbitLink board or a RabbitSys-enabled board.
Multiple instances of Dynamic C can run simultaneously. This means multiple debugging sessions are possible over different serial ports. This is useful for debugging boards that are communicating among themselves.
A file is displayed in a text window when it is opened or created. More than one text window may be open. If the same file is in multiple windows, any changes made to the file in one window will be reflected in all text windows that display that file. Dynamic C supports normal Windows text editing operations.
A mouse (or other pointing device) may be used to position the text cursor, select text, or extend a text selection. The keyboard may be used to do these same things. Text may be scrolled using the arrow keys, the PageUp and PageDown keys, and the Home and End keys. The up, down, left and right arrow keys move the cursor in the corresponding directions.
The Home key may be used alone or with other keys.
|
Home |
Move to beginning of line. |
|
Ctrl+Home |
Move to beginning of file. |
|
Shift+Home |
Select to beginning of line. |
|
Shift+Ctrl+Home |
Select to beginning of file. |
The End key may be used alone or with other keys.
|
End |
Move to end of line. |
|
Ctrl+End |
Move to end of file. |
|
Shift+End |
Select to end of line. |
|
Shift+Ctrl+End |
Select to end of file. |
The Ctrl key works in conjunction with the arrow keys:
|
Ctrl+Left |
Move cursor to previous word. |
|
Ctrl+Right |
Move cursor to next word. |
|
Ctrl+Up |
Move editor window up, text moves down one line. Cursor is not moved. |
|
Ctrl+Down |
Move editor window down, text moves up one line. Cursor is not moved. |
The Ctrl key also works in conjunction with “[” for delimiter matching. Place the cursor before the delimiter you are attempting to match and press “Ctrl+[”. The cursor will move to just before the matching delimiter.
Note that delimiters in comments are also matched. For example, in the following code, <Ctrl+[> counts commented-out braces in the matching, giving a false indication that the main function has balanced curly braces when in fact it does not.
main()
{
{
//}
/*
}
*/
Dynamic C’s main menu has eight command menus, as well as the standard Windows system menus.
An available command can be executed from a menu by either clicking the menu and then clicking the command, or by pressing the Alt key to activate the menu bar, using the left and right arrow keys to select a menu, and then using the up or down arrow keys to select a command before pressing the Enter key.
For some of us it is easier to type keyboard shortcuts than to use a mouse. A menu can be activated by pressing the Alt key while pressing the underlined letter of the menu name. This is the de facto standard, as it is used in numerous commercial software products. Pressing the Alt key allows you to see which character in the menu name is underlined, as shown in this second screenshot of Dynamic C’s main menu. All the keyboard shortcuts on the main menu use the first letter of the menu name in the shortcut. Some keyboard shortcuts have this obvious connection while others do not. See the Editor Tab screenshot in Section 16.7 for some examples of not so obvious keyboard shortcuts. A keyboard shortcut that is not menu specific is the Esc key, which will make any visible menu disappear.
Right click anywhere in the editor window and a popup menu will appear. All of the menu options, with the exception of Open File at Cursor, are available from the main menu, e.g., New is an option in the File menu and was described earlier with the other options for that menu.
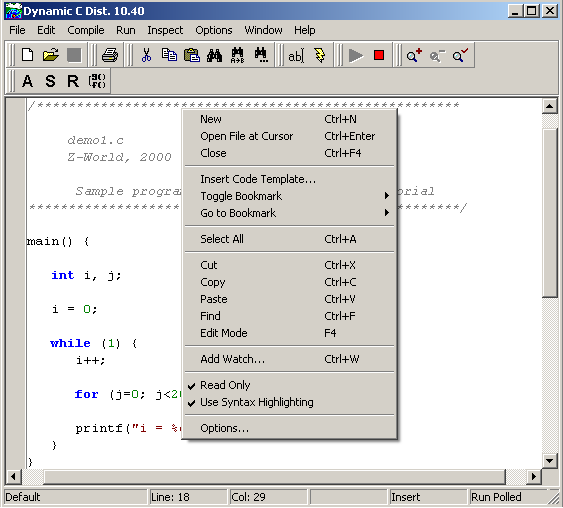
Attempts to open the file whose name is under the cursor. The file will be opened in a new editor window, if the file name is listed in the “lib.dir” file as either an absolute path or a path relative to the Dynamic C root directory or if the file is in Dynamic C’s root directory. As a last resort, an Open dialog box will appear so that the file may be manually chosen.
To select the File menu: click on its name in Dynamic C’s main menu or press <Alt+F>.
Creates a blank, untitled program in a new window, called the text window or the editor window. If you right click anywhere in the text window a popup menu will appear. It is available as a convenience for accessing some frequently used commands.
Presents a dialog box to specify the name of a file to open. To select a file, type in the file name (pathnames may be entered), or browse and select it. Unless there is a problem, Dynamic C will present the contents of the file in a text window. The program can then be edited or compiled. Multiple files can be selected by holding down <Ctrl> then clicking the left mouse on each filename you want to open, or by dragging the selection rectangle over multiple filenames.
The Save command updates an open file to reflect changes made since the last time the file was saved. If the file has not been saved before (i.e., the file is a new untitled file), the Save As dialog will appear to prompt for a name. Use the Save command often while editing to protect against loss during power failures or system crashes.
Presents a dialog box to save the file under a new name. To select a file name, type it in the File name field. The file will be saved in the folder displayed in the Save in field. You may, of course, browse to another location. You may also select an existing file. Dynamic C will ask you if you wish to replace the existing file with the new one.
This command saves all modified files that are currently open.
Closes the active editor window. If there is an attempt to close a modified file, Dynamic C will ask you if you wish to save the changes. The file is saved when Yes is clicked or “y” is typed. If the file is untitled, there will be a prompt for a file name in the Save As dialog. Any changes to the document will be discarded if No is clicked or “n” is typed. Choosing Cancel results in a return to Dynamic C with no action taken.
Allows a project file to be created, opened, saved, saved as a different name and closed. See Chapter 18, “Project Files.” for all the details on project files.
Displays the Page Setup dialog box. Margins, page orientation, page numbers and header and footer properties are all chosen here.
The “Printer Setup” button is in the bottom left of the dialog box. It brings up the Print Setup dialog box, which allows a printer to be selected. The “Network’ button allows printers to be added or removed from the list of printers.
Displays whichever file is in the active editor window in the Preview Form window, showing how the text will look when it is printed. You can search and navigate through the printable pages and bring up the Print dialog box.
Brings up the Print dialog box, which allows you to choose a printer. Only text in an editor window can be printed. To print the contents of debug windows the text must be copied and pasted to an editor window. (The Stdio window is an exception; its contents may be automatically written to a file, which may then be printed.) As many copies of the text as needed may be printed. If more than one copy is requested, the pages may be collated or uncollated.
Close Dynamic C after prompting to save any unsaved changes to open files.
Click the menu title or press <Alt+E> to select the EDIT menu.
This option undoes recent changes in the active edit window. The command may be repeated several times to undo multiple changes. Undo operations have unlimited depth. Two types of undo are supported—applied to a single operation and applied to a group of the same operations (2 continuous deletes are considered a single operation.
Dynamic C only discards undo information if the “Undo after save” option is unchecked in the Editor dialog under Environment Options.
Redoes changes recently undone. This command only works immediately after one or more Undo operations.
The keyboard shortcut <Ctrl+A> no longer clears all breakpoints. Starting with Dynamic C 10.21, this shortcut selects all text in the active window. “Select All” works in the following windows: Editor, Stdio, Message, Disassembly, Registers, Stack, Watch, Stack Tracing, Grep Results and Function Description.
Removes selected text and saves to the clipboard.
Makes a copy of text selected in a file or in a debug window. The text is saved on the clipboard.
Pastes text from the clipboard to the current insertion point. Nothing can be pasted in a debugging window. The contents of the clipboard may be pasted virtually anywhere, repeatedly (as long as nothing new is cut or copied into the clipboard), in the same or other source files, or even in word processing or graphics program documents.
Opens the code template list at the current cursor location. Clicking on a list entry or pressing <Enter> inserts the selected template at the cursor location in the active edit window. The arrow keys may be used to scroll the list. Pressing the first letter of the name of a code template selects the first template whose name starts with that letter. Pressing the same letter again will go to the next template whose name starts with that letter. Continuing to press the same letter cycles through all the templates whose name starts with that letter.
To create, edit or remove templates from the code template list, go to Environment Options and click on the Code Templates tab.
Toggle one of ten bookmarks in the active edit window.
Go to one of ten bookmarks in the active edit window. Executing this command again will take you back to the location you were at before going to the bookmarked location.
Finds first occurrence of specified text. Text may be specified by selecting it prior to opening the Find dialog box if the option “Find text at cursor” is checked in the Editor dialog under Environment Options. Only one word may be selected; if more than one word is selected, the last word selected appears as the entry for the search text. More than one word of text may be specified by typing it in or selecting it from the available history of search text.
There are several ways to narrow or broaden the search criteria using the Find dialog box. For example, if Case sensitive is unchecked, then “Switch” and “SWITCH” would match the search text “switch.” If Whole words only is checked, then the search text “switch” would not match “switches.” Selecting Entire scope will cause the whole document to be searched. If Selected text is chosen and the Persistent blocks option was checked in the Editor tab in Environment Options, the search will take place only in the selected text.
Finds and replaces the specified text. Text may be specified by selecting it prior to opening the Replace Text dialog box. Only one word may be selected; if more than one word is selected, the last word selected appears as the entry for the search text. More than one word of text may be specified by typing it in or selecting it from the available history of search text. The replacement text is typed or selected from the available history of replacement text.
As with the Find dialog box, there are several ways to narrow or broaden the search criteria. An important option is Prompt on replace. If this is unchecked, Dynamic C will not prompt before making the replacement, which could be dangerous in combination with the choice to Replace All.
Once search text has been specified with the Find or Replace commands, the Find Next command will find the next occurrence of the same text, searching forward or in reverse, case sensitive or not, as specified with the previous Find or Replace command. If the previous command was Replace, the operation will be a replace.
Behaves the same as Find Next except in the opposite direction. If Find Next is searching forward in the file, Reverse Find Next will search backwards, and vice versa.
This option searches for text in the currently open file(s) or in any directory (optionally including subdirectories) specified. Standard Unix-style regular expressions are used.
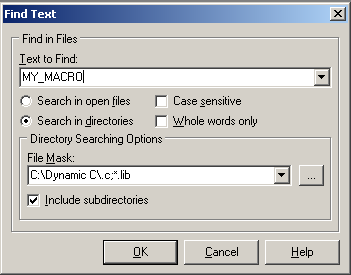
A window with the search results is displayed with an entry for each match found. Double-clicking on an entry will open the corresponding file and place the cursor on the search string in that file. Multiple file types can be separated by semicolons. For example, entering C:\mydirectory\*.lib;*.c will search all .lib and .c files in mydirectory.
The “Search Results” window has a right-click menu. Dynamic C 10.21 introduces two options in this menu: the ability to select all text in the window <Ctrl+A> and the ability to delete any text selected in the window.
Positions the insertion point at the beginning of the specified line.
Closes all open GREP Search Results windows.
Locates the previous compilation error in the source code. Any error messages will be displayed in a list in the Compiler Messages window after a program is compiled. Dynamic C selects the previous error in the list and displays the offending line of code in the text window.
Locates the next compilation error in the source code. Any error messages will be displayed in a list in the Compiler Messages window after a program is compiled. Dynamic C selects the next error in the list and displays the offending line of code in the text window.
Switches to edit mode from run, also known as debug, mode. After successful compilation or execution, no changes to the file are allowed unless in edit mode. If the compilation fails or a runtime error occurs, Dynamic C comes back already in edit mode.
Click the menu title or press <Alt+C> to select the Compile menu.
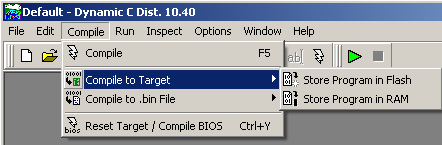
Compiles a program and loads it to the target or to a .bin file. When you press <F5> or select Compile from the Compile menu, the active file will be compiled according to the current compiler options. Compiler options are set in the Compiler tab of the Project Options dialog. When compiling directly to the target, Dynamic C queries the attached target for board information and creates macros to automatically configure the BIOS and libraries.
Any compilation errors are listed in the automatically activated Compiler Messages window. Press <F1> to obtain more information for any error message that is highlighted in this window.
Expands to one of two choices. They override any BIOS Memory Setting choice made in the Compiler tab of the Project Options dialog.
The compiler will show board type and other board specific information while doing a compile to target. The information shown will be identical to what the compiler shows when compiling to a .bin file.
Compiles a program and writes the image to a .bin file.
The target configuration used in the compile is determined in the Compiler tab of the Project Options dialog. From there, under “Default Compile Mode,” you can choose to use the attached target or a defined target configuration. The defined target configuration is accessed by clicking on the Targetless tab which will reveal three additional tabs: RTI File, Specify Parameters and Board Selection. To learn more about these tabs see “Targetless Tab” on page 291.
The .bin file may be used with a device programmer to program multiple targets; or the Rabbit Field Utility (RFU) can be used to load the .bin file to the target.
If you are creating a special program such as a cold loader that starts at address 0x0000 you can exclude the BIOS from being compiled into the .bin file by unchecking the option to include it. This is done by choosing Options | Project Options | Compiler and clicking on the “Advanced...” button.
In addition to the .bin file, several other files are generated with this compile option. For example, if you compile demo1.c to a .bin file, the following files will be in the same folder as demo1.c:
DEMO1.bak - backup of the application source file (made at compile time, when this option is enabled).
demo1.bdl - binary image download file (used when loading the application to a connected target).
DEMO1.brk - debugger breakpoint information.
demo1.hdl - no longer used.
demo1.hex - simple Intel HEX format output image file; the serial DLM samples download a DLP's HEX file and load the image to Flash.
DEMO1.map - the application's code/data map file (RabbitBios.map is also generated, separately). For more information on the map file, see “Map File Generation” on page 335
DEMO1.rom - ROM "output" file, containing redundant addresses (due to fixups); it's used to generate the BDL, BIN, HEX, and HDL files.
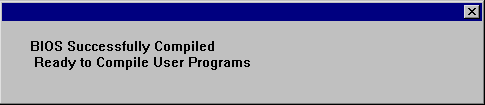
This option reloads the BIOS to RAM or Flash, depending on the choice made under BIOS Memory Setting in the Compiler dialog (viewable from Options | Project Options).
The following message will appear upon successful compilation and loading of BIOS code.
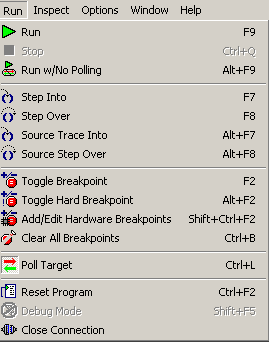
Click the menu title or press <Alt+R> to select the Run menu.
Starts program execution from the current breakpoint. Registers are restored, including interrupt status, before execution begins. If in Edit mode, the program is compiled and downloaded.
The “Stop” command stops the program at the current point of execution. Usually, the debugger cannot stop within nodebug code. On the other hand, the target can be stopped at an RST 028h instruction if an RST 028h assembly code is inserted as inline assembly code in nodebug code. However, the debugger will never be able to find and place the execution cursor in nodebug code.
This command is identical to the “Run” command, with one exception. The PC polls the target every three seconds by default to determine if the target has crashed. When debugging via RabbitLink, polling is used to make the RabbitLink keep its connection to the PC open. Polling does have some overhead, but it is very minimal. If debugging ISRs, it may be helpful to disable polling.
Executes one C statement (or one assembly language instruction if the assembly window is displayed) with descent into functions. If nodebug is in effect and the Assembly window is closed, execution continues until code compiled without the nodebug keyword is encountered.
Executes one C statement (or one assembly language instruction if the assembly window is displayed) without descending into functions.
Executes one C statement with descent into functions when the assembly window is open. If nodebug is in effect, execution continues until code compiled without the nodebug keyword is encountered.
Executes one C statement without descending into functions when the assembly window is open.
Toggles a soft breakpoint at the current cursor location. Soft breakpoints do not affect the interrupt state at the time the breakpoint is encountered, whereas hard breakpoints and hardware breakpoints do.
Breakpoints can be toggled in edit mode as well as in debug mode. Breakpoint information is not only retained when going back and forth from edit mode to debug mode, it is stored when a file is closed and restored when the file is reopened. Breakpoints are set in library code the same way they are set in application code.
Toggles a hard breakpoint at the current cursor location. A hard breakpoint differs from a soft breakpoint in that interrupts are disabled when the hard breakpoint is reached. Note that a hard breakpoint is not the same as a hardware breakpoint.
Breakpoints can be toggled in edit mode as well as in debug mode. Breakpoint information is not only retained when going back and forth from edit mode to debug mode, it is stored when a file is closed and restored when the file is reopened. Breakpoints are set in library code the same way they are set in application code.
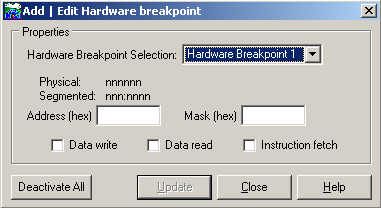
Hardware breakpoints were introduced with the Rabbit 4000 and are supported by Dynamic C beginning with version 10.21.
Choosing this menu item brings up the window pictured here. The drop-down menu allows you to select one of the six available hardware breakpoints (breakpoint 0 is used internally).
A breakpoint can be generated on an address match by checking data write, data read, instruction fetch or any combination thereof.
There are two permissable address types: physical ([0x]xxxxxx) and segmented (xxx:xxxx). The address type to use depends on several factors. One factor is the method used to discern the desired address. For example, selecting one of the disassemble options from the Inspect menu opens the Assembly window and displays segmented addresses. Naturally, it saves time to use the address type most readily available.
To disable a single breakpoint, select it in the drop-down menu, uncheck the data write, data read, and/or the instruction fetch boxes and click “Update.” Starting with Dynamic C 10.50, hardware breakpoints are disabled when code is executing within the debug kernel.
The text box labeled “Mask” allows you to mask off any of the 24 bits of the address. A “one” in the mask inhibits the corresponding bit in the address match register from contributing to the address match condition, essentially creating a “don’t care” condition for that address bit. Basically, the mask allows you to express a range of addresses, thus its value should be chosen carefully.
A hardware breakpoint configured for a data write and/or data read can be triggered by internal I/O writes and/or reads. For example, in the following code, with a hardware breakpoint set at address 0x000600 (i.e., VRAM00) for a data read, Dynamic C will stop after the “ld” instruction.
void main() {
#asm debug
ioi ld a, (VRAM00)
#endasm
}
Note that a hardware breakpoint is not the same as a hard breakpoint. Hardware breakpoints are “hard” in the sense that interrupts are disabled by default when the breakpoint occurs.
Clears all software breakpoints. The shortcut was changed to Ctrl+B in Dynamic C 10.21.
A check mark means that Dynamic C will poll the target. The absence of a check mark means that Dynamic C will not poll the target.
If “Poll Target” is selected, Dynamic C sends a message to the target every three seconds and expects a response. If no response is received, Dynamic C ends the debugging session. Several things can be responsible for the target not replying to a polling message, such as loss of power, running in a loop with interrupts disabled, leaving interrupts disabled long enough to disrupt the serial port A ISR, or overwriting serial port A configuration, among other things. Polling does introduce overhead, but it is minimal since it only occurs every three seconds. Without polling turned on, Dynamic C will only notice an unresponsive target when the user attempts to do some other sort of debugging such as stopping the target, setting a breakpoint, single stepping, setting or evaluating a watch, etc.
Resets program to its initial state. The execution cursor is positioned at the start of the main function, prior to any global initialization and variable initialization. (Memory locations not covered by normal program initialization may not be reset.)
The initial state includes only the execution point (program counter), memory map registers, and the stack pointer. The “Reset Program” command will not reload the program if the previous execution overwrites the code segment. That is, if your code is corrupted, the reset will not be enough; you will have to reload the program to the target.
In Dynamic C you have the ability to switch back to debug mode from edit mode without having to recompile the program.
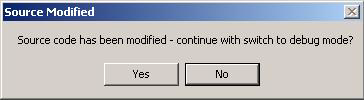
If the source file has been modified while in edit mode, a popup dialog lets you choose whether to run the non-modified code or to go ahead and recompile and download again.
Disconnects the programming serial port between PC and target so that the target serial port and the PC serial port are both accessible to other applications.
Click the menu title or press <Alt+I> to open the Inspect menu.
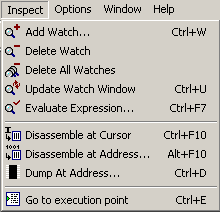
The Inspect menu provides commands to manipulate watch expressions, view disassembled code, and produce hexadecimal memory dumps. The Inspect menu commands and their functions are described here.
This command displays the “Add Watch Expression” dialog. Enter watch expressions with this dialog box.
A watch expression may be any valid C expression, including assignments, function calls, and preprocessor macros. (Do not include a semicolon at the end of the expression.) If the watch expression is successfully compiled, it and its outcome will appear in the Watches window.
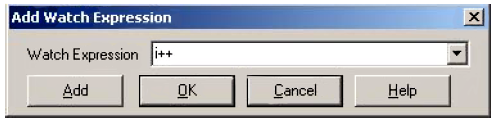
If the cursor in the active window is positioned over a variable or function name, that name will appear in the Watch Expression text box when the Add Watch Expression dialog box appears. Clicking the Add button will add the given watch expression to the watch list, and will leave the Add Watch Expression dialog open so that more watches can be added. Clicking the “OK” button will add the given watch expression to the watch list, and close the Add Watch Expression dialog.
To add a local variable to the Watch window, the target controller’s program counter (PC) must point to the function where the local variable is defined. If the PC points outside the function, an error message will display when “Add” or “OK” is pressed, stating that the variable is out of scope or not declared.
An example of the results displayed in the Watches window appears below.
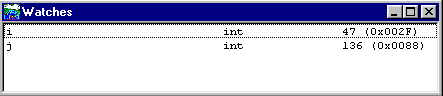
If the evaluation of a watch expression causes a run-time exception, the exception will be ignored and the value displayed in the Watches window for the watch expression will be undefined.
Structure members are displayed whenever a watch expression is set on a struct. The Debug Windows tab of the Environment Options menu lets you set flyover hint evaluation of any expression that can be watched without having to explicitly set the watch expression. See “Watch” on page 298 and “Watch Window” on page 278 for more details.
Removes highlighted entry from the Watches window.
Removes all entries from the Watches window.
Forces expressions in the Watches window to be evaluated. If the target is running nodebug code, the Watches window will not be updated, and the PC will lose communication with the target. Inserting an RST 028h instruction into frequently executed nodebug code will allow the Watches window to be updated while running in nodebug code. Normally the Watches window is updated every time the execution cursor is changed, that is, when a single step, a breakpoint, or a stop occurs in the program.
Brings up the Evaluate Expression dialog where you can enter a single expression in the Expression dialog. The result is displayed in the Result text box when Evaluate is clicked. Multiple Evaluate Expression dialogs can be active at the same time.
Loads, disassembles and displays the code at the current editor cursor location. This command does not work in user application code declared as nodebug. Also, this command does not stop the execution on the target.
Brings up the Disassemble at Address dialog where you can enter an address at which to begin disassembly. The format of the address is either the logical address specified as a hex number (0xnnnn or just nnnn) or as an xpc:offset pair separated by a colon (nn:mmmm).
The Disassembled Code window displays the result. See “Assembly (F10)” on page 299 for details about this window.
Allows blocks of raw values in any memory location to be displayed. Values are displayed on the screen or written to a file. If separate I&D space is enabled, you can choose which logical space to examine: instruction space or data space.
Dynamic C highlights differences when displaying to the screen: each time you single step in C or assembly changed data is highlighted in reverse video in the Memory Dump window. (This is also true for the Stack and Register windows.)
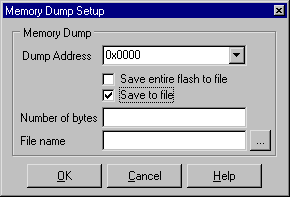
When writing to a file, the option “Save to file” requires a file pathname and the number of bytes to dump. The option “Save entire flash to file” requires a file pathname. If you are running in RAM, then it will be RAM that is saved to a file, not Flash, because this option simply starts dumping physical memory at address zero.
When displaying on a screen, a Memory Dump window is opened. A typical screen display appears below. Although the cursor is not visible in the screen capture below of the Memory Dump window, it is hovering over logical memory location 0x013c, which has a value of 0x79. This information is given in the fly-over text and also in the titlebar. Either or both of these options may be disabled by right clicking in the Memory Dump window or in the Options | Environment Options, Debug Windows tab, under Specific Preferences for the Memory Dump window.
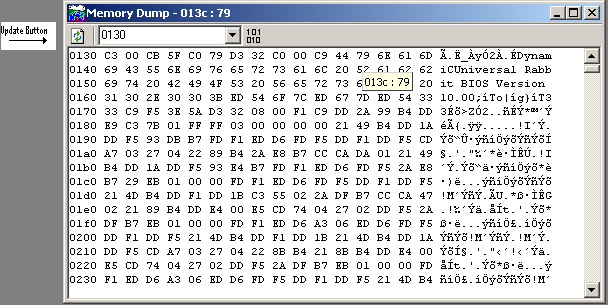
Memory Dump windows may be scrolled. Scrolling causes the contents of other memory addresses to appear in the window. Hotkeys ArrowUp, ArrowDown, PageUp, PageDown are active in the Memory Dump window. The window always displays as many lines of 16 bytes and their ASCII equivalent as will fit in the window.
Values in the Dump window are updated automatically either when Dynamic C stops or comes to a breakpoint. Updates only occur if the window is updateable. This can be set either by right clicking in the Memory Dump window and toggling the updateable menu item, or by clicking on the Debug Windows tab in Options | Environment Options. Select Memory Dump under Specific Preferences, then check the option “Allow automatic updates.” The Memory Dump window can be updated at any time by clicking the Update button on the tool bar or by right clicking and choosing Update from the popup menu.
The Memory Dump window is capable of displaying three different types of dumps. A dump of a logical address ([0x]mmmm) will result in a 64k scrollable region (0x0000 - 0xffff). A dump of a physical address ([0x]mmmmm) will result in a dump of a 1M region (0x00000 - 0xfffff). A dump of an xpc:offset address (nn:mmmm) will result in a segmented dump range of 4k, 64k, or “Full Range,” depending on the size set on the Debug Windows tab on the Options | Environment Options menu.
Note that adding a leading zero to a logical address makes it a physical address.
Any number of dump windows may be open at the same time. The type of dump or dump region for a dump window can be changed by entering a new address in the toolbar’s text entry area. To the right of this area is a button that, when clicked, will cause the address in the text entry area to be the first address in the Dump window. The toolbar for a dump window may be hidden or visible.
When stopped in debug mode, this option places the cursor at the statement or instruction that will execute next.
Click on the Options menu title or press <Alt+O> to select the Options menu.
Dynamic C comes with a built-in, full-featured text editor. It may be customized to suit your style using the Environment Options dialog box. The dialog box has tabs for various aspects of the editor. Note that keyboard shortcuts for some of the options have no character to underline, so the character is shown between brackets. For example, when the Editor menu options are visible, Alt+Q is the keyboard shortcut for toggling the option “Cursor through tabs”.
Click on the Editor tab to display the following dialog. Installation defaults are shown.
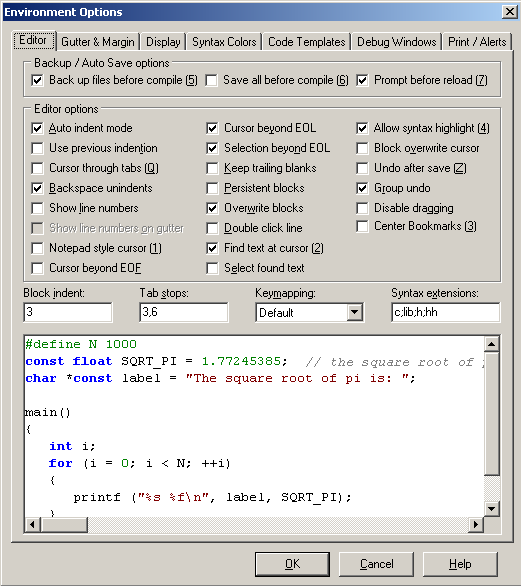
Backup / Auto Save Options
These three features were added in Dynamic C 10.21: automatically backup a file before compilation, automatically save all open editor windows before compilation, turn off the prompt that asks you if you want to reload a modified file.
The Editor options are detailed here. All actions taken are immediately reflected in the text area at the bottom of the dialog, and in any open editor windows.
Auto Indent Mode
Checking this causes a new line to match the indentation of the previous line.
Use Previous Indention
Uses the same characters for indentation that were used for the last indentation. If the last indentations was 2 tabs and 4 spaces, the next indentation will use the same combination of whitespace characters.
Cursor Through Tabs
With this option checked, the right and left arrow keys will move the cursor through the logical spaces of a tab character. If this is unchecked the cursor will move the entire length of the tab character.
Backspace Unindents
Check this to backspace through indentation levels. If this is unchecked, the backspace will move one character at a time.
Show Line Numbers
Check this to display line numbers in the text window. This must be checked to activate the option Show line numbers on gutter.
Show Line Numbers on Gutter
If gutters are visible, check this to display line numbers in the gutter.
Notepad Style Cursor
Checking this causes the cursor to behave similar to Notepad.
Cursor Beyond EOF
Check this option to move the cursor past the end of the file.
Cursor Beyond EOL
Check this option to move the cursor past the end of the line.
Selection Beyond EOL
Check this option to select text beyond the end of the line.
Keep Trailing Blanks
Check this option to keep extra spaces and tabs at the end of a line when a new line is started.
Persistent Blocks
Check this option to keep selected text selected when you move the cursor using the arrow keys. Using the mouse to move the cursor will deselect the block of text. Using menu commands or keyboard shortcuts will affect the entire block of selected text. For example, pressing <Ctrl+X> will cut the selected block. But pressing the delete key will only delete one character to the right of the cursor. If this option was unchecked, pressing the delete key would delete all the selected text.
If this option is checked and the Find or Replace dialog is opened with a piece of text selected in the active edit window, the search scope will default to that bit of selected text only.
Overwrite Blocks
Check this option to enable overwriting a selected block of text by pressing a key on the keyboard. The block of text may be overwritten with any character, including whitespaces or by pressing delete or backspace.
Double Click Line
Check this option to allow an entire line to be selected when you double click at any position in the line. When this option is unchecked, double clicking will select the closest word to the left of the cursor.
Find Text at Cursor
When either the Search or Replace dialogs are opened, if this option is checked the word at the cursor location in the active editor window will be placed into the “Text to Find” edit box. If this option is unchecked, the edit box will contain the last search string.
Select Found Text
The color of found text can be set in Options | Environment Options, on the Syntax Colors page. Select “Search Match” from the Element list box, then set the foreground and background colors.
If this box is unchecked the Search Match color scheme will be used when a match is found, but the text will not be selected for copy or delete operations. If this option is checked, the matched text will automatically be selected so that it may be copied or deleted.
Use Syntax Highlight
Check this option to enable the Display and Syntax Color choices to be active. When this option is checked, the “Use Syntax Highlighting” in the edit window’s right-click menu allows you to toggle the syntax highlighting in the active file.
Block Overwrite Cursor
Check this option to show the cursor as a block when an editor is placed in overwrite mode.
Undo After Save
Check this option to enable undo operations after a file has been saved. With this option unchecked, the undo list for a file is erased each time the file is saved.
Group Undo
Check this option to undo changes one group at a time. With this option unchecked, each operation is undone individually.
Disable Dragging
Checking this option disables drag and drop operations: i.e., the ability to move selected text by pressing down the left mouse button and dragging the text to a new location.
Center Bookmarks
Check this option so that when you jump to a bookmark it is centered in the editor window.
Block Indent
The number of spaces used when a selected block is indented using <Ctrl+k+i> or unindented using <Ctrl+k+u>.
Tab Stops
This is a comma separated list of numbers which indicate the number of spaces per tab stop. If only one number is entered, say “3,” then the first tab stop is 3 spaces, as is each additional tab stop. Every additional number in the list indicates the number of spaces for all subsequent tabs. E.g., if the list consists of “3,6,12” the first tab stop is 3 spaces, the second tab stop is 3 more spaces and all subsequent tab stops are 6 spaces.
Keymapping
The keyboard has five different default key mappings: Default, Classic, Brief, Epsilon and Visual Studio. Change the keymapping with this pulldown menu.
Click on the Gutter & Margin tab to display the following dialog.
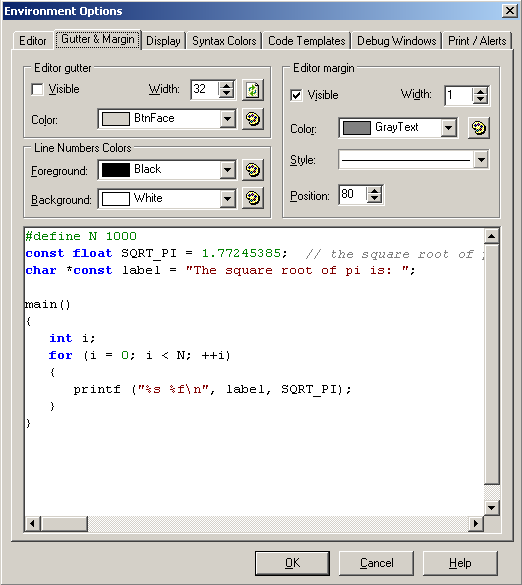
Editor gutter
Check the “Visible” box to create a gutter in the far left side of the text window. Use the “Width” scroll bar to set the width of the gutter in pixels. The button to the right updates the width parameter. Changing the width and clicking on OK at the bottom of the dialog does not update the gutter width; you must click on the button. Use the “Color” pulldown menu to set the color. The button to the right brings up more color choices.
Editor margin
Check the “Visible” box to create a right-hand margin in the text window. Use the “Width” scroll bar and the “Color” pulldown menu to set the like-named attributes of the margin line. The “Style” pulldown menu displays the line choices available: a solid line and various dashed lines. The “Position” scroll box is used to place the margin at the desired location in the text window.
Line Number Colors
If line numbers are set to visible and are not placed on the gutter, the Foreground color will set the color of the line numbers and the Background color will set the color on which the line numbers appear.
Click on the Display tab to display the following dialog.
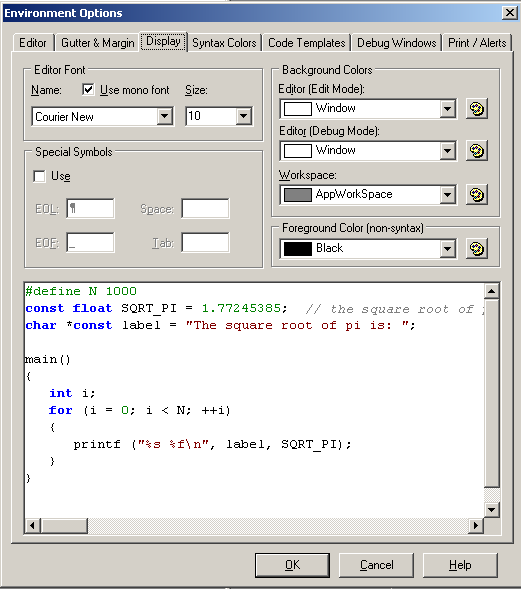
Editor Font
This area of the dialog box is for choosing the font style and size. Check Use mono font for fixed spacing with each character; note that this option limits the available font styles.
Special Symbols
Check the box labeled “Use” to view end of line, end of file, space and/or tab symbols in the editor window.
Background Colors
This area of the dialog box is for choosing background colors for editor windows and the main Dynamic C workspace. The editor window can have a different background color in edit mode than it does in run mode. Each pulldown menu has an icon to the right that brings up additional color choices.
Foreground Color (non-syntax)
If syntax highlighting is not used, the color selected here will be the foreground color used in the editor file.
Click on the Syntax Colors tab to display the following dialog.
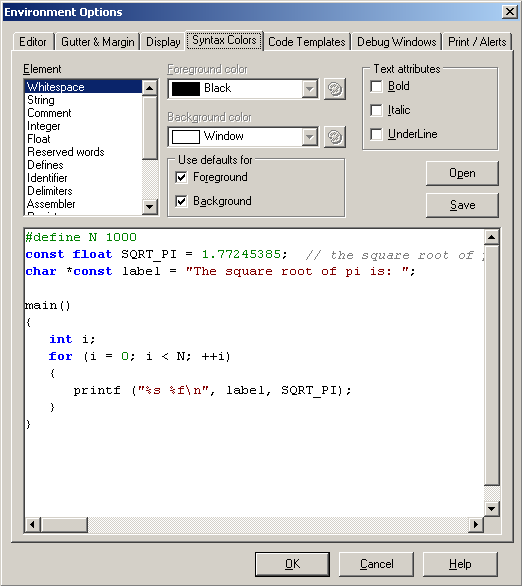
Element
In this text box are the different elements that may be in a file (strings, comments, integers, etc.). For each one you may choose a foreground and a background color. You may also opt to use the default colors: black for foreground and white for background. In the “Text” attribues area of the dialog box, you may set bold, italic and/or underline for any of the elements.
Open / Save Buttons
These buttons load and save color styles into files with a .rgb extension. Clicking the “Open” button will bring up an Open File dialog box, where you choose a .rgb file that will set all of the syntax colors. There is a subdirectory titled Schemes under the root Dynamic C directory that has some predefined color schemes that can be used. Opening a .rgb file makes its colors immediately active in all open editor windows. If you close the Environment Options window without saving the changes, the colors will go back to whatever they were before you opened the .rgb file.
Click the Code Template tab to display the following dialog.
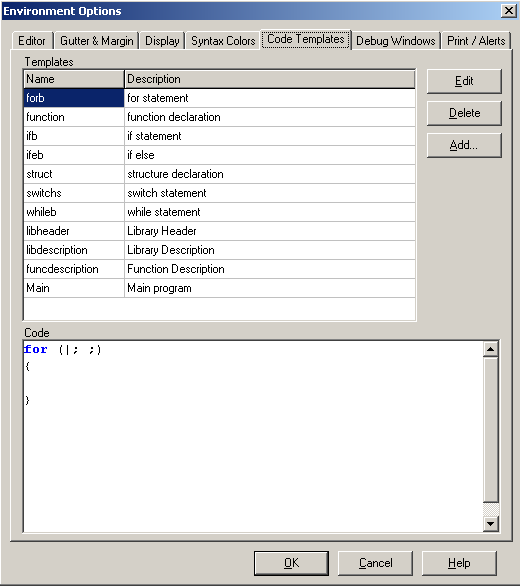
As you can see, there are several predefined templates. The “Edit and Delete” buttons allow the like-named operations on existing templates. The “Add” button gives the ability to create custom templates.
To bring up the list of defined templates, Dynamic C must be in edit mode. Then you must do one of the following: press <Ctrl+j> or right click in the editor window and choose “Insert Code Template” from the popup menu or choose the Edit command menu and select “Insert Code Template.” Clicking on the desired template name inserts that template at the cursor location.
Click on the Debug Windows tab to display the following dialog. Here is where you change the behavior and appearance of Dynamic C debug windows.
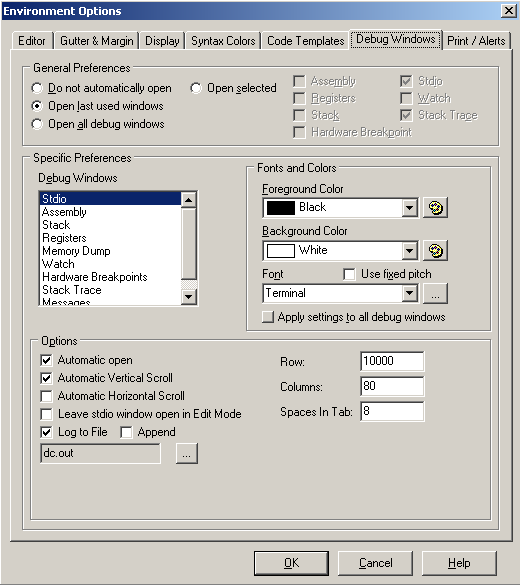
Select which which debug windows will be opened after a successful compile under the General Preferences section.
The Specific Preferences section is where you customize each type of window as selected in the Debug Windows list. Colors and fonts are chosen here, as well as other options.
The previous screen shows the options available for the Stdio windowi. They are described here. You may modify or check as many as you would like.
Check this to open the Stdio window the first time printf() is encountered.
Check this to force vertical scroll when text is displayed outside the view of the window. If this option is unchecked, the text display doesn’t change when the bottom of the window is passed; you have to use the scroll bar to see text beyond the bottom of the window.
Check this to force horizontal scroll when text is displayed outside the view of the window.
Uncheck this to leave the Stdio window open when returning to edit mode. This feature was introduced in Dynamic C 10.21. It is checked by default to behave the same as prior versions of Dynamic C.
Check this to direct output to a file. If the file does not exist it will be created. If it does exist it will be overwritten unless you also check the option to append the file.
Specifies the maximum number of rows that can hold Stdio data.
Specifies the maximum number of columns that can hold Stdio data. When the maximum column is reached, output automatically wraps to the next row.
Tab stops display as the number of spaces specified here.
The various Find commands available on the Edit menu can be used directly in the Stdio window.
Starting with Dynamic C 10.21, the “Select All” item available on the Run menu can be used to select all text in the Stdio window. The keyboard shortcut for “Select All” is Ctrl+A.
Assembly Window
The Assembly window displays the disassembled code from the program just compiled. All but the opcode information may be toggled off and on using the checkboxes shown below. For more information about this window see Section 13.3.5.
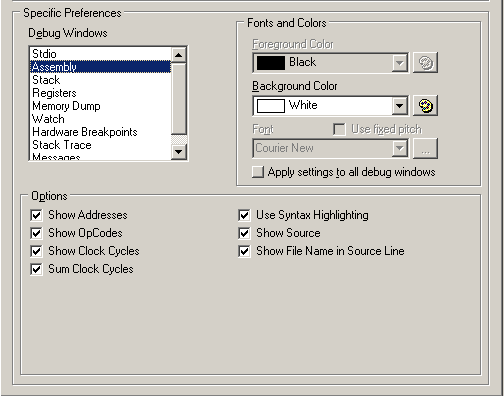
Check this to show the logical address of the instruction in the far left column.
Check this to show the hexidecimal number corresponding to the opcode of the instruction.
Check this to show the number of clock cycles needed to execute the instruction in the far right column. Zero wait states is assumed. Two numbers are shown for conditional return instructions. The first is the number of cycles if the return is executed, the second is the number of cycles if the return is not executed.
Check this to total the clock cycles for a block of instructions. The block of instructions must be selected and highlighted using the mouse. The total is displayed to the right of the number of clock cycles of the last instruction in the block. This value assumes one execution per instruction, so looping and branching must be considered separately.
Toggle syntax highlighting. Click on the Syntax tab to set the different colors.
Check this to display the Dynamic C statement corresponding to the assembly code.
Check this to prepend the file name to the Dynamic C statements corresponding to the assembly code.
For this window you must choose one of the following conditions: “Show register history” or “Show registers as editable.” When the Register Contents window opens it will be in editable mode by default. Selecting “Show Register history” will override the default setting.
In this mode, a snapshot of the register values is displayed every time program execution stops. The line (L:) and column (C:) of the cursor is noted, followed by the register and flag values. The window is scrollable and sections may be selected with the mouse, then copied and pasted.
Each time you single step in C or assembly changed data is highlighted in the Register window. (This is also true for the Stack and Memory Dump windows.)
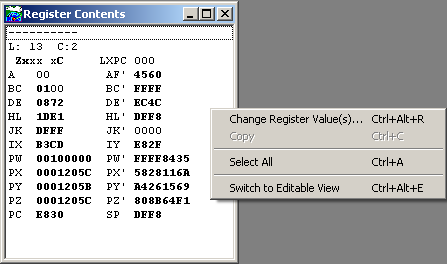
A click of the right mouse button brings up the menu pictured above. Choosing Change Register Value(s)... brings up a dialog where you can enter new values for any of the registers, except SP, PC and LXPC.
In this mode, you can increment or decrement most of the registers, all but the SP, PC and XPC registers.
This screen shows the Register Contents window in editable mode. It is divided into registers on the left and flags on the right.
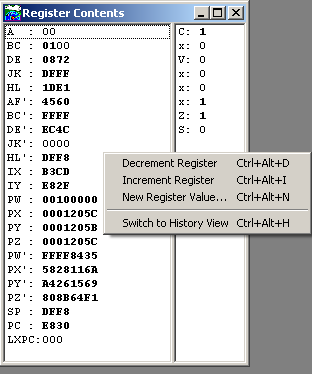
A click of the right mouse button on the register side will bring up the menu pictured here. You can switch to history view or change register values for all but the SP, PC and LXPC registers.
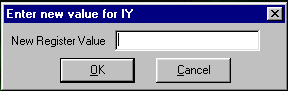
The option New Register Value will bring up a dialog to enter the new register value. Hex values must have “0x” prepended to the value. Values without a leading “0x” are treated as decimal.
A click of the right mouse button on the flags side of the window will bring up a menu that lets you toggle the selected flag (Ctrl+Alt+T) or switch to history view (Ctrl+Alt+H).
Memory Dump Window
For more information on using the Memory Dump window go to page 261.
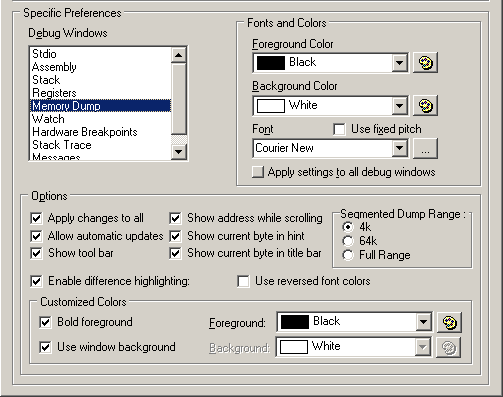
Changes made in this dialog will be applied to all memory dump windows.
The memory dump window will be updated every time program execution stops (breakpoint, single step, etc.). Each time you single step changed data in the memory dump window is highlighted in reverse video.
Each dump window has the option of a tool bar that has a button for updating the dumped region and a text entry box to enter a new starting dump address.
While using the scroll bar, a small popup box appears to the right of the scroll bar and displays the address of the first byte in the window. This allows you to know exactly where you are as you scroll.
The address and value of the byte that is under the cursor is displayed in a small popup box.
The address and value of the byte that is under the cursor is displayed in the title bar.
The memory dump window can display 3 different types of dumps. A dump of a logical address will result in a 64k scrollable region (0x0000 - 0xffff). A dump of a physical address will result in a dump of a 1M region (0x00000 - 0xfffff). A dump of an xpc:offset address will result in either a 4k, 64k or 1M dump range, depending on how this option is set.
If a 4k or 64k range is selected, the dump window will dump a 4k or 64k chunk of memory using the given xpc. If “Full Range” is selected, the window will dump 00:0000 - ff:ffff. To increment or decrement the xpc, use the “+’ and “-” buttons located below and above the scroll bar. These buttons are visible only for an xpc:offset dump where the range is either 4k or 64k.
The Watches window configuration options, Enable watch expression evalution in flyover hint and Show watch expression evaluation errors in flyover hint, do not actually affect the Watches window. When checked, they allow you to use flyover hints in the source code window to see the value of watchable expressions.
Move the cursor over a variable to see its current value and over a function to see its logical address or its return value. If you highlight the name of a function (e.g., my_function) you will see the location of the code in memory. If you highlight the function call (e.g., my_function(my_parm)) the function will be called and you will see its return value. If the cursor is over a structure member, the flyover hint will only contain information about the structure, not the individual member.
Hardware Breakpoints
There are no configuration options for the Hardware Breakpoints window.
There are no configuration options for the Stack Trace window.
Click on the Print/Alerts tab to display the following dialog. You may access both the Page Setup dialog and Print Preview from here.
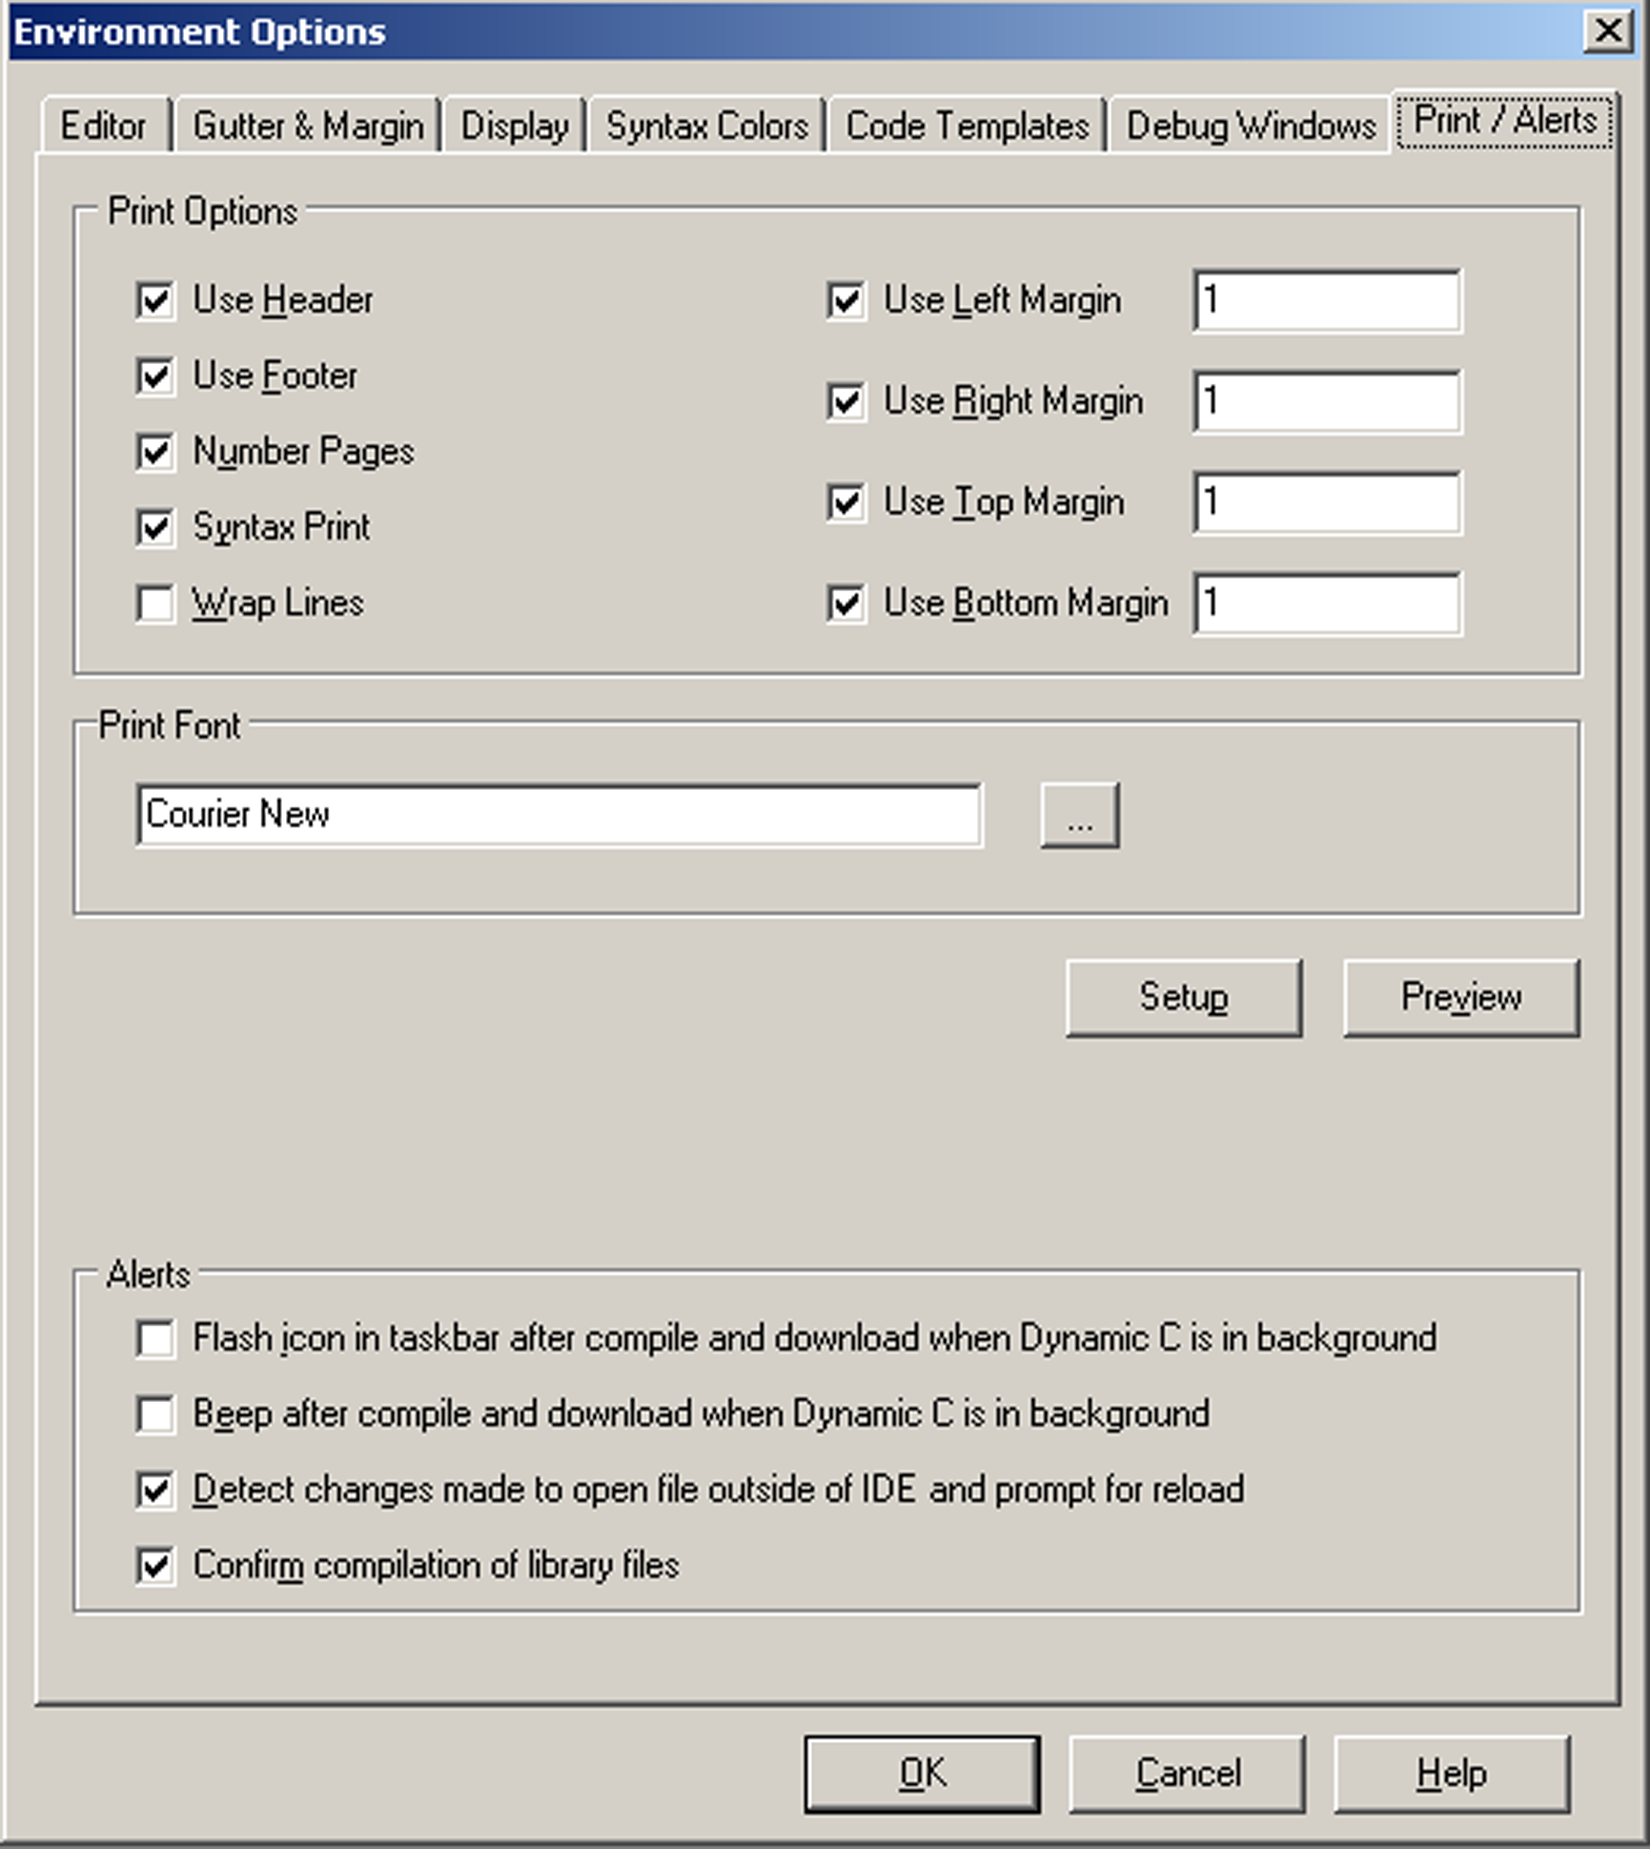
The Page Setup dialog works in conjunction with the Print/Alerts dialog. The Page Setup dialog is where you define the attributes of headers, footers, page numbering and margins for the printed page. The Print/Alerts dialog is where you enable and disable these settings. You may also change the font family and font size that will be used by the printer. This does not apply to the fonts used for headers and footers, those are defined in the Page Setup dialog.
There are four checkboxes in the Alerts area of this dialog. The first two signal a successful compile and download, one with a visual signal, the other auditory. The third checkbox detects if a file that is currently open in Dynamic C has been modified by an external source, i.e., a third-party editor; and if checked, will bring up a dialog box asking if you want to reload the modified file so that Dynamic C is working with the most current version. The last checkbox, if checked, causes Dynamic C to query when an attempt is made to compile a library file to make sure that is what is desired.
You may choose zero or more of these alerts.
Settings used by Dynamic C to communicate with a target, and to compile and run programs are accessible by using the Project Options dialog box. The dialog box has tabs for various aspects of communicating with the target, the BIOS and the compiler.
This is where you setup for serial communication. The following options are available when the Use Serial Connection radio button is selected.
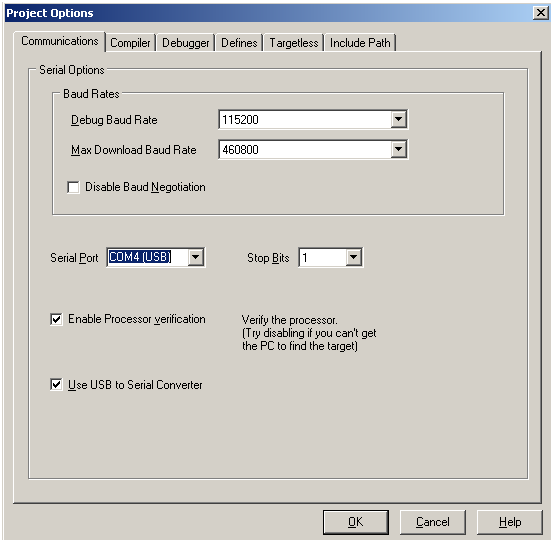
This defaults to 115200 bps. It is the baud rate used for target communications after the program has been downloaded.
When baud negotiation is enabled, Dynamic C will start out at the selected baud rate and work downwards until it reaches one both it and the target can handle.
Disable Baud Negotiation
Dynamic C negotiates a baud rate for program download. (This helps with USB or anyone who happens to have a high-speed serial port.) This default behavior may be disabled by checking the Disable Baud Negotiation checkbox. When baud negotiation is disabled, the program will download at 115k baud or 56k baud only. When enabled, it will download at speeds up to 460k baud, as specified by Max Download Baud Rate.
Serial Port
This drop-down menu lists PC COM ports that may be connected to the Rabbit-based target. It defaults to COM1. Starting with version 10.21, Dynamic C identifies which ones are USB ports.
Stop Bits
The number of stop bits used by the serial drivers. Defaults to 2.
Processor detection is enabled by default. The connection is normally checked with a test using the Data Set Ready (DSR) line of the PC serial connection. If the DSR line is not used as expected, a false error message will be generated in response to the connection check.
To bypass the connection check, uncheck the “Enable Processor Verification” checkbox. This allows custom designed systems to not connect the STATUS pin to the programming port. Also, disabling the connection check allows non-standard PC ports or USB converters that might not implement the DSR line to work.
Check this checkbox if a USB to serial converter cable is being used. Dynamic C will then attempt to compensate for abnormalities in USB converter drivers. This mode makes the communications more USB/RS232 converter friendly by allowing higher download baud rates and introducing short delays at key points in the loading process. Checking this box may also help non-standard PC ports to work properly with Dynamic C.
Click on the Compiler tab to display the following dialog. If you are using a version of Dynamic C prior to 10.21, you will not have the section labeled, “Attached Target Memory Type” shown in the following screenshot. All other sections apply. If you are using a Rabbit 4000 with Dynamic C 10.21 or later, all sections shown below apply.
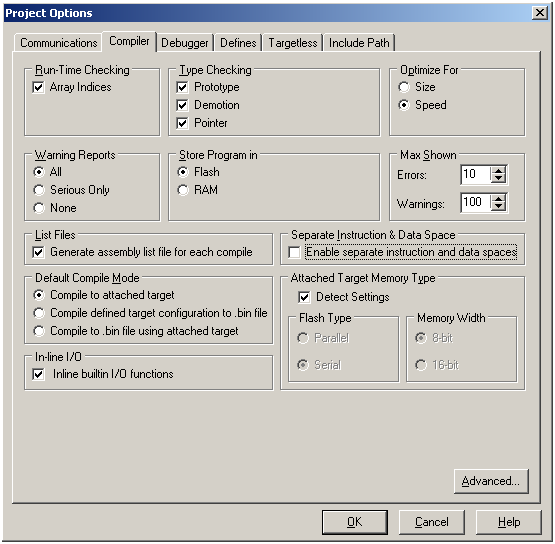
Run-Time Checking
These options, if checked, can allow a fatal error at run time. They also increase the amount of code and cause slower execution, but they can be valuable debugging tools.
Check array bounds. This feature adds code for every array reference.
This was removed as an option in Dynamic C 10.50. In prior versions: check for invalid pointer assignments. A pointer assignment is invalid if the code attempts to write to a location marked as not writable. Locations marked not writable include the entire root code segment. This feature adds code for every pointer reference.
Functions marked as nodebug disable the run-time checking options selected in the GUI.
Performs strict type checking of arguments of function calls against the function prototype. The number of arguments passed must match the number of parameters in the prototype. In addition, the types of arguments must match those defined in the prototype. Rabbit recommends prototype checking because it identifies likely run-time problems. To use this feature fully, all functions should have prototypes (including functions implemented in assembly).
Detects demotion. A demotion automatically converts the value of a larger or more complex type to the value of a smaller or less complex type. The increasing order of complexity of scalar types is:
char
unsigned int
int
unsigned long
long
float
A demotion deserves a warning because information may be lost in the conversion. For example, when a long variable whose value is 0x10000 is converted to an int value, the resulting value is 0. The high-order 16 bits are lost. An explicit type casting can eliminate demotion warnings. All demotion warnings are considered non-serious as far as warning reports are concerned.
Generates warnings if pointers to different types are intermixed without type casting. While type casting has no effect in straightforward pointer assignments of different types, type casting does affect pointer arithmetic and pointer dereferences. All pointer warnings are considered non-serious as far as warning reports are concerned.
Allows for optimization of the program for size or speed. When the compiler knows more than one sequence of instructions that perform the same action, it selects either the smallest or the fastest sequence, depending on the programmer’s choice for optimization.
The difference made by this option is less obvious in the user application (where most code is not marked nodebug). The speed gain by optimizing for speed is most obvious for functions that are marked nodebug and have no auto local (stack-based) variables.
This option tells the compiler whether to report all warnings, no warnings or serious warnings only. It is advisable to let the compiler report all warnings because each warning is a potential run-time bug. Demotions (such as converting a long to an int) are considered non-serious with regard to warning reports.
Store Program in
This option selects the memory type (Flash or RAM) in which to store the program.
A single, default BIOS source file defined in the system registry when installing Dynamic C is used for compiling both to RAM and Flash.
With this option, the compiler will load the BIOS to Flash when cold-booting, and will compile the user program to Flash where it will normally reside. For boards with serial boot flashes, the BIOS will copy the flash image to the fast RAM.
With this option, the compiler will load the BIOS to RAM when cold-booting and compile the user program to RAM. This option is useful if you want to use breakpoints while you are debugging your application, but you don’t want interrupts disabled while the debugger writes a breakpoint to Flash (this can take 10 ms to 20 ms or more, depending on the Flash type used). It is also possible to have a target that only has RAM for use as a slave processor, but this requires more than checking this option because hardware changes are necessary that in turn require a special BIOS and coldloader.
Max Shown
The scroll menus labeled “Errors” and “Warnings” limit the number of error and warning messages displayed after compilation.
Checking this option generates an assembly list file for each compile. A list file contains the assembly code generated from the source file.
The list file is placed in the same directory as your program, with the name <Program Name>.LST. The list file has the same format as the Disassembled Code window. Each C statement is followed by the generated assembly code. Each line of assembly code is broken down into memory address, opcode, instruction and number of clock cycles. See page 299 for a screen shot of the Disassembled Code window.
Separate Instruction and Data Space
When checked, this option enables separate I&D space, doubling the amount of root code and root data space available.
Please note that if you are compiling to a 128K RAM, there is only about 12K available for user code when separate I&D space is enabled.
One of the following options will be used when Compile | Compile is selected from the main menu of Dynamic C or when the keyboard shortcut <F5> is used. The setting shown here may be overridden by choosing a different option in the Compile menu. The setup for targetless compile may differ for some board series. Please check your user manual for differences in setup.
a program is compiled and loaded to the attached target.
a program is compiled and the image written to a .bin file. The target configuration used in the compile is taken from the parameters specified in Options | Project Options. The Targetless tab allows you to choose an already defined board type or you may define one of your own.
a program is compiled and the image written to a .bin file using the parameters of the attached controller.
Attached Target Memory Type
One of the following options must be selected:
Checking this option directs Dynamic C to query the attached board as to its program flash type.
Uncheck “Detect Settings” to activate the “Flash Type” option. The choices are parallel and serial flash.
Selecting “Parallel” for the flash type activates the “Memory Width” option, offering a choice of 8- or 16-bit parallel flash.
If checked, the built-in I/O functions (WrPortI(), RdPortI(), BitWrPortI() and BitRdPortI()) will have efficient inline code generated instead of function calls if all arguments are constants, with the exception of the 3rd parameter of BitWrPortI() and WrPortI(), which may be any valid expression.
If this box is checked, but a call to one of the aforementioned functions is made with non-constant arguments, (with the exception of the 3rd parameter for the 2 write functions) then a normal function call is generated.
Click on this button to reveal the Advanced Compiler Options dialog.
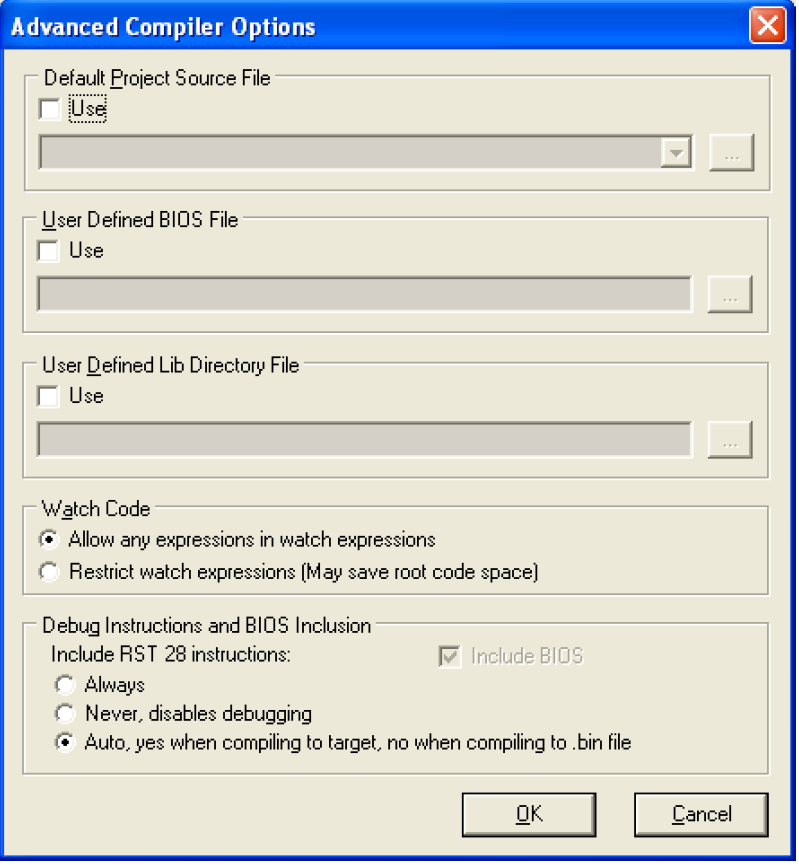
Default Project Source File
Use this option to set a default source file for your project. If this box is checked, then when you compile, the source file named here will be used and not the file that is in the active editor window. If the file named here is not open, it will be opened into a new editor window, which will be the new active editor window.
Use this option to change from the default BIOS to a user-specified file. Enter or select the file using the browse button/text box underneath this option. The check box labeled “use” must be selected or else the default file BIOS defined in the system registry will be used. See the Rabbit 4000 Designer’s Handbook for more BIOS information.
User Defined Lib Directory File (same as the command line compiler option “-lf”)
The Library Lookup information retrieved with <Ctrl+H> is parsed from the libraries found in the “lib.dir” file, which is part of the Dynamic C installation. Checking the Use box for User Defined Libraries File, allows the parsing of a user-defined replacement for the “lib.dir” file. Library files must be listed in the “lib.dir” file (or its replacement) to be available to a program.
If the function description headers are formatted correctly (see “Function Description Headers” on page 40), the functions in the libraries listed in the user-defined replacement for the “lib.dir” file will be available with <Ctrl+H> just like the user-callable functions that come with Dynamic C.
Allow any expressions in watch expressions
This option causes any compilation of a user program to pull in all the utility functions used for expression evaluation.
Restricting watch expressions (May save root code space)
Choosing this option means only utility code already used in the application program will be compiled.
Debug Instructions and BIOS Inclusion
Include RST 28 instructions
There are three radio buttons for this option:
If “Always” is selected, the debug and nodebug keywords and compiler directives work as normal. Debug code consists mainly of RST 28h instructions inserted after every C statement. This selection also controls the definition of a compiler-defined macro symbol, DEBUG_RST. If the menu item is checked, then DEBUG_RST is set to one, otherwise it is zero.
If “Never, disables debugging” is selected, the compiler marks all code as nodebug and debugging is not possible.
The default selection is “Auto, yes when compiling to target, no when compiling to .bin file”.
The only reason to include RST 28 instructions if debugging is finished and the program is ready to be deployed, is to allow some current (or planned) diagnostic capability of the Rabbit Field Utility (RFU) to work in a deployed system. This option affects both code compiled to .bin files and code compiled to the target. To run the program after compiling to the target with RST 28 instruction included, disconnect the target from the programming port and reset the target CPU.
Include BIOS
If this is checked, the BIOS, as well as the user program, will be included in the .bin file. If you are creating a special program such as a cold loader that starts at address 0x0000, then this option should be unchecked.
When you are compiling a program to the attached target controller, the BIOS is always included.
Click on the Debugger tab to display the following dialog. This is where you enable/disable debugging tools. Disabling parts of the debug kernel saves room to fit tight code space requirements.
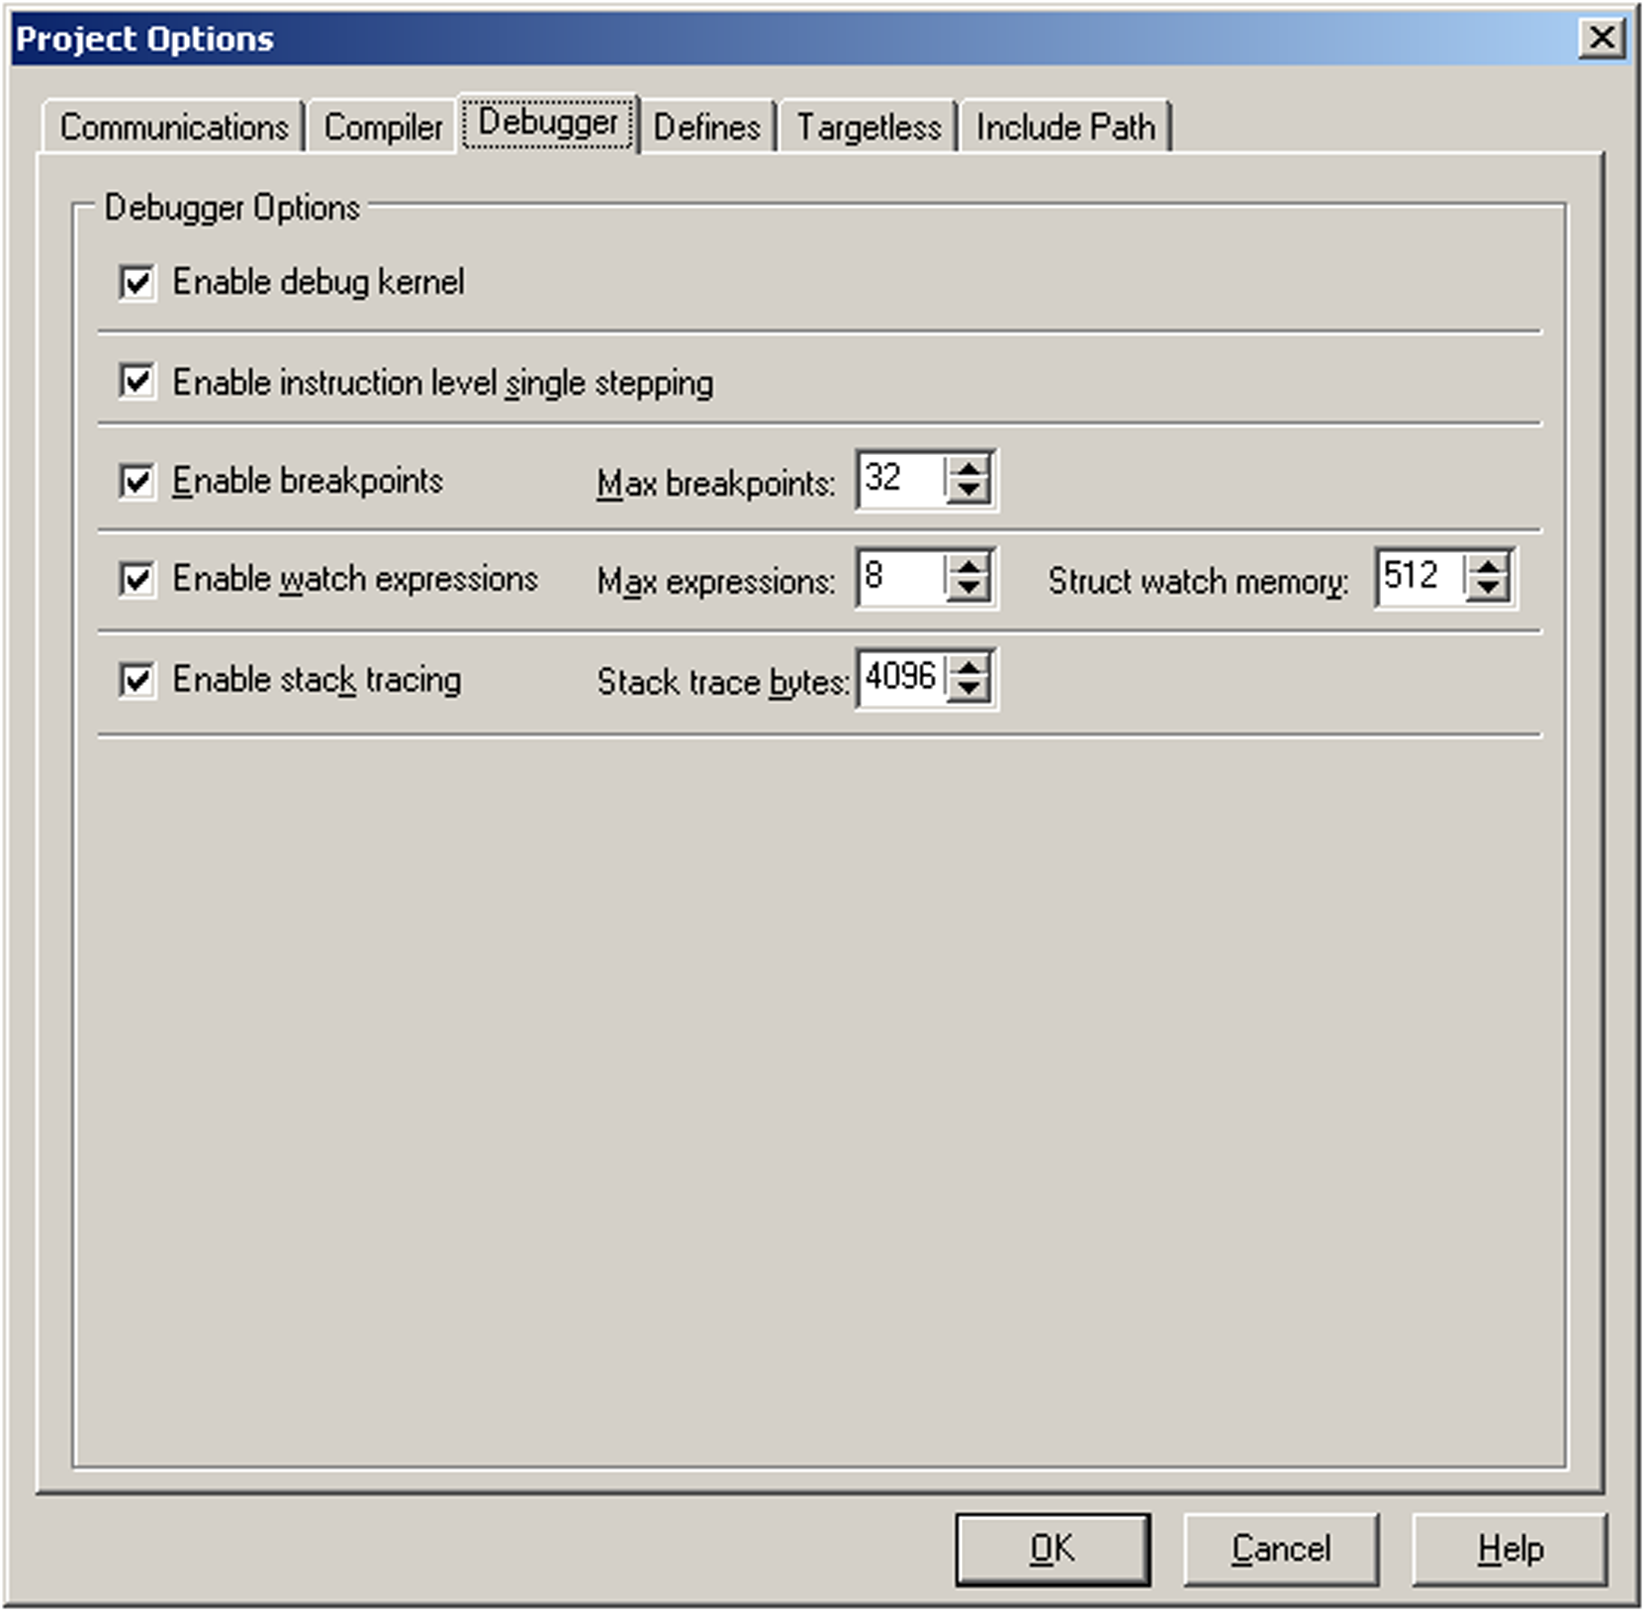
Enable debug kernel
Leaving this option unchecked allows you to compile your application without the debug kernel. You must check this option to set any of the other debug options.
Enable instruction level single stepping
If this is checked when the assembly window is open, single stepping will be by instruction rather than by C statement. Unchecking this box will disable instruction level single stepping on the target and, if the assembly window is open, the debug kernel will step by C statement.
If this box is checked, the debug kernel will be able to toggle breakpoints on and off and will be able to stop at set breakpoints. This is where you set the maximum number of breakpoints the debug kernel will support. The debug kernel uses a small amount of root RAM for each breakpoint, so reducing the number of breakpoints will slightly reduce the amount of root RAM used.
If this box is unchecked, the debug kernel will be compiled without breakpoint support and the user will receive an error message if they attempt to add a breakpoint.
If this box is checked, watch expressions will be enabled. This is where you set the maximum number of watch expressions the debug kernel will support. The debug kernel uses a small amount of root RAM for evaluating each watch expression, so reducing the number of watches will slightly reduce the amount of root RAM used.
With the watch expression box unchecked, the debug kernel will be compiled without watch expressions support and the user will receive an error message if they attempt to add a watch expression.
Watch expressions automatically include the addition of structure members when a watch expression is set on a struct. Some extended memory is reserved for handling watch expressions on structs. As shown in the above screen shot, 512 bytes of xmem is reserved by default. This can be changed to anything in the range 32 to 4096. Be aware that this watch memory is a tradeoff: not only does it dictate the number and complexity of watched structs, but also impacts the amount of memory available for xalloc() calls.
If this box is checked the Stack Trace window is available to show the function call sequence leading to any point at which the program is stopped. The Stack Trace window shows a concise history of the execution path and values of local variables and function arguments that led to the current breakpoint, all for a very small cost in execution time and BIOS memory.
To the right of the checkbox is a spin/edit box for entering the maximum number of bytes of the current stack to transfer from the target at each breakpoint. The allowable range is 32 bytes to 4096 bytes inclusive. The default is 4096 bytes. If the stack depth is smaller than the number in this spin/edit box, only the depth number of bytes is transferred.
With the “Enable stack tracing” box unchecked, the debug kernel and the user program will be compiled without stack tracing support. Changing the status of the checkbox or the number of stack trace bytes forces a recompilation of the BIOS the next time the user program is compiled.
See “Stack Trace (Ctrl+T)” on page 301 for details on using this debug window.
The Defines tab brings up a dialog box with a window for entering (or modifying) a list of defines that are global to any source file programs that are compiled and run. The macros that are defined here are seen by the BIOS during its compilation.
Syntax:
DEFINITION[DELIMETER DEFINITION[DELIMETER DEFINITION[...]]]
DEFINITION: MACRONAME[[WS]=[WS]VALUE]
DELIMETER: ';' or 'newline'
MACRONAME: the same as for a macro name in a source file
WS: [SPACE[SPACE[...]]]
VALUE: CHR[CHR[...]]
CHR: any character except the delimeter character ';', which is entered as the character pair "\;"
Notes:
Do not continue a definition in this window with '\', simply continue typing as a long line will wrap.
In this window hitting the Tab key will not enter a tab character (\t), but will tab to the OK button.
The command line compiler honors all macros defined in the project file that it is directed to use with the project file switch, -pf, or default.dcp if -pf is not used. See command line compiler documentation.
A macro redefined on the command line will supersede the definition read from the project file.
Examples and File Equivalents:
Example:
DEF1;MAXN=10;DEF2
Equivalent:
#define DEF1
#define MAXN 10
#define DEF2
Example:
DEF1
MAXN = 10
DEF2
Equivalent:
#define DEF1
#define MAXN 10
#define DEF2
Example:
STATEMENT = A + B = C\;;DEF1=10
Equivalent:
#define STATEMENT A + B = C;
#define DEF1 10
Example:
STATEMENT = A + B = C\;
FORMATSTR = "name = %s\n"
DEF1=10
Equivalent:
#define STATEMENT A + B = C;
#define FORMATSTR "name = %s\n"
#define DEF1 10
Click on the Targetless tab to reveal three additional tabs: RTI File, Specify Parameters and Board Selection. The setup for targetless compile may differ for some board series. Please check your user manual for differences in setup.
RTI File
Click on this tab to open a Rabbit Target Information (RTI) file for viewing. The file is read-only. You may not edit RTI files, but you may create one by selecting an entry in the Board Selection list and clicking on the button Save as RTI. Or you may define a board configuration in the Specify Parameters dialog and then save the information in an RTI file. Details follow.
Specify Parameters
This is where you may define the parameters of a controller for later use in targetless compilations.
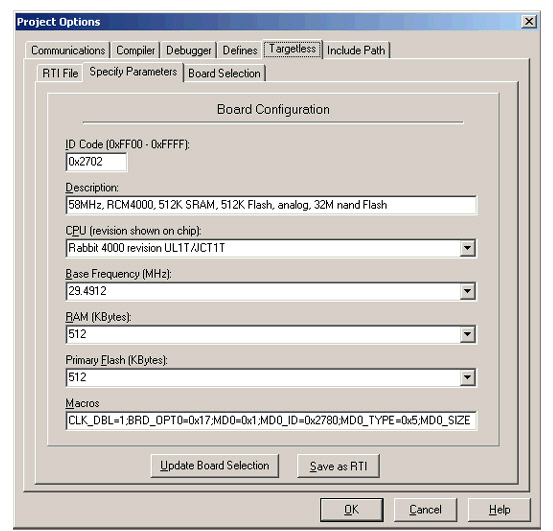
The term “Primary Flash” refers to the Flash device connected to /CS0, not the total amount of Flash available on the board.
The result may be saved to a RTI file for later use, or the result may be saved to the list of board configurations. User defined ID codes are in the form 0xFFnn.
The list of board configurations is viewable from the Board Selection tab. The highlighted entry in the list of board configurations is the one that will be used when the compilation uses a defined target configuration, that is, when the Default Compile Mode on the Compiler tab is set to “Compile defined target configuration to .bin file” and “Compile” or “Compile to .bin file” is chosen from the Compile menu.
If you save to the list of board configurations by clicking on the button labeled “Update Board Selection” on the Specify Parameters tab, then you must fill in all fields of the dialog. The baud rate, calculated from the value labeled “Base Frequency (MHz),” only applies to debugging. The fastest baud rate for downloading is negotiated between the PC and the target.
To save to an RTI file only requires an entry in the CPU field.
The correct choice for the CPU field is found on the chip itself. The information is printed on the second line from the top on both the Rabbit 4000 and 5000. The table below lists the possible values for these chips.
|
Rabbit Microprocessor |
non-RoHS |
RoHS |
|
Rabbit 4000 |
n/a |
UL#T, JCT#T |
|
Rabbit 5000 |
n/a |
JZ#T |
Where “#” is the revision number and the letters are associated information.
Dynamic C 10.60 introduced the standard C feature of #include. With the Include Path tab, you can tell Dynamic C what paths to search for include files as seen in the following dialog.
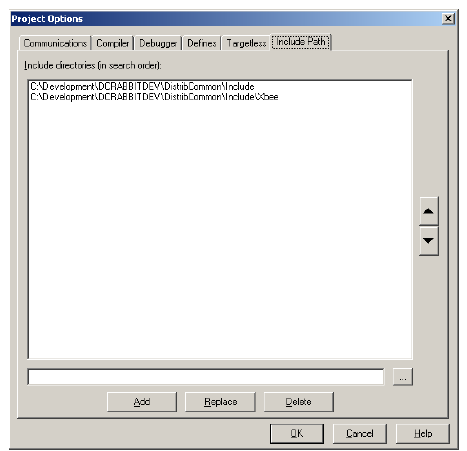
To add a directory to the Include directories, you can either type it directly into the text field at the bottom of the dialog, or you can press the "…" button which will bring up a dialog that allows you to select the directory through a file browser interface. Pressing "Add" will then add your new directory to the list.
You can also edit directories that are already in the list by first selecting the directory and then using either the "Replace" or "Delete" buttons. "Replace" will replace the currently selected Include directory with the text in the bottom text field. "Delete" will remove the currently selected Include directory from the list.
The arrow buttons at the right allow the ordering of paths to be changed - select a path in the list and move it up or down with the arrows to change the search order (the top item being the first path searched).
NOTE: The include paths are unrelated to LIB.DIR and #use. They are only used by #include.
Selecting this menu item reveals a list of all menu button groups, i.e., the groups of icons that appear in toolbars beneath the title bar and the main menu items (File, Edit, …). This area is called the control bar. To remove the control bar from the Dynamic C window, uncheck “View Menu Buttons.” Any undocked toolbars (i.e., toolbars floating off the control bar) will still be visible. You undock a toolbar by placing the cursor on the two vertical lines on the left side of the toolbar and dragging it off the control bar.
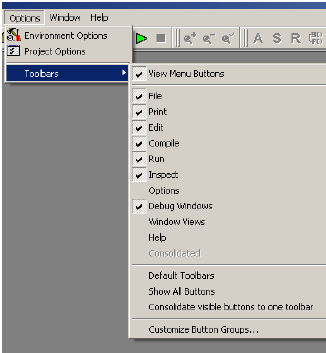
Each menu button group (File, Edit, Compile, Run, Options, Watch, Debug Window, WindowView and Help) has a checkbox for choosing whether to make its toolbar visible on the control bar.
To quickly return to showing only the icons visible by default, select “Default Toolbars.”
Select the option, “Consolidate visible buttons to one toolbar” to do exactly that—create one toolbar containing all visible icons. Doing that, enables the option Consolidated, which toggles the visibility of the consolidated toolbar, even when it is undocked from the control bar.
Select “Customize Button Groups” to bring up the Customize Menu Buttons window. This window allows you to change which buttons are associated with which button group on the toolbar.
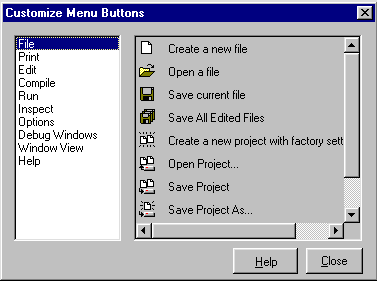
Choose a button group on the left side of the window; this causes the icons for the buttons in that group to display on the right side of the window. Click and drag an icon from the right side of the window to the desired button group on the toolbar.
To remove an icon from its button group, click and drag the icon off the toolbar or to another button group on the toolbar. The Customize Menu Buttons window must be open to change the position of an icon on the toolbar.
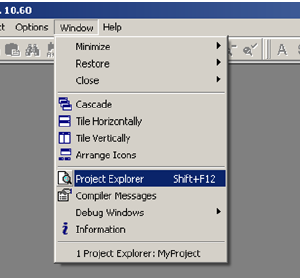
Click the menu title or press <Alt+W> to display the Window menu.
You can choose to minimize, restore or close all open windows or just the open debug window or just the open editor windows. The second group of items is a set of standard Windows commands that allow the application windows to be arranged in an orderly way.
The Compiler Messages option is a toggle for displaying that window. This is only available if an error or warning occurred during compilation.
Starting with Dynamic C 10.60, you can organize your projects using multiple .c files as is common with most C development tools. Dynamic C 10.60 introduces an interface to support this new functionality called the Project Explorer. To access the Project Explorer window, click on
“Window->Project Explorer” or use the keyboard shortcut <Shift + F12>.
The Project Explorer window serves as your primary project interface for managing and compiling projects with multiple .c files. The project is defined as a list of .c files that will be linked into the final executable BIN file and sent to the target. A "main file" (the top node in the file tree) is specified as the primary application source code. The main file is treated as the first compiled file and will usually include the main function. Note that this is an addition to the project functionality that exists in previous versions.
NOTE: Dynamic C .LIB files should not be added to the project explorer file list.
Creating a new project or creating a project out of an old Dynamic C application is easy:
Create your primary application .c source file (if it does not already exist) and save it
Open the Project Explorer window
Click “Add Files”
Select all C files that are part of your project and click "Open"
If your main file isn't at the top, right click on it and select "Set as Main File"
Your new project is ready to run!
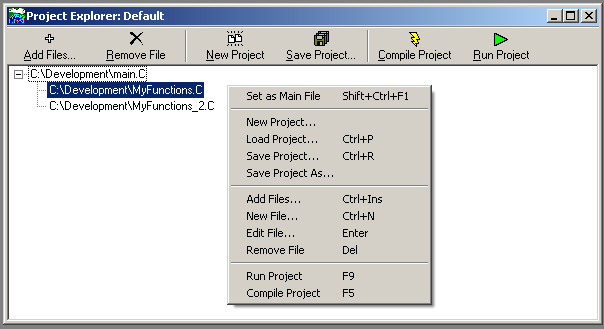
Across the top of the Project Explorer window is a toolbar consisting of commonly-used operations. The full list of new project operations can be accessed through the right-click menu. The operations of the project menu are summarized in the table below.
|
Command |
Function |
Hot key |
|
Set as Main File |
Indicates that the currently selected C file is the primary application source file |
Shift+Ctrl+F1 |
|
New Project |
Create a new project (closes current project) |
|
|
Load Project |
Load a previously saved project (closes current project) |
Ctrl+P |
|
Save Project |
Saves currently loaded project |
Ctrl+R |
|
Save Project As |
Saves currently loaded project with a new name |
|
|
Add Files |
Adds existing files to the project list (file must be created separately) |
Ctrl+Ins |
|
New File |
Creates a new .c file, opening a new editor window (file must be added to the project separately) |
Crtl+N |
|
Edit File |
Opens the currently selected file for editing (you can also double-click on a file in the list) |
Enter |
|
Remove File |
Removes the currently selected file from the project list (does NOT delete the file) |
Del |
|
Run Project |
Compile, download, and run the current project on the attached target |
F9 (when Project Explorer has focus) |
|
Compile Project |
Compile and download the current project to the attached target |
F5 (when Project Explorer has focus) |
Pressing F5 with the Project Explorer window in focus compiles the entire project. Similarly, F9 runs the entire project. Without the Project Explorer window in focus, Dynamic C functions exactly as previous versions - F5 compiles the current file in focus and F9 runs it.
There are also a few additional menu items to facilitate compilation of projects. There are targeted compile options for Flash/RAM and compiling to BIN file in addition to a Compile Project option, which is the same as the operation accessible through the Project Explorer window. There is also a Run Project option under the Run menu which can be used to run the currently loaded project at any time."
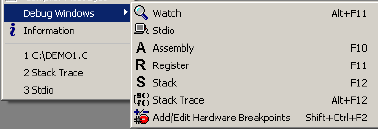
The Debug Windows option opens a secondary menu, whose items are toggles for displaying the like-named debug windows. You can scroll these windows to view larger portions of data, or copy information from these windows and paste the information as text anywhere. More information is given below for each window.
At the bottom of the Window menu is a list of current windows, including source code windows. Click on one of these items to bring its window to the front, i.e., make it the active window.
Select Watch to activate or deactivate the Watches window. The Add Watch command on the Inspect menu will do this too. The Watches window displays watch expressions whenever Dynamic C evaluates watch expressions. A watch expression for a structure will automatically include all members of the structure. Previous versions of Dynamic C required each struct member to be added as a separate watch expression.
Keep in mind that when single stepping in assembly, the value of the watch expression may not be valid for variables located on the stack (all auto variables). This is because the debug kernel does not keep track of the pushes and pops that occur on the stack, and since watches of stack variables only make sense in the context of the pushes and pops that have happened, they will not always be accurate when assembly code is being single stepped.
Select this option to activate or deactivate the Stdio window. The Stdio window displays output from calls to printf(). If the program calls printf(), Dynamic C will activate the Stdio window automatically if it is not already open, unless “Automatic open” is unchecked in the Debug Windows dialog in Options | Environment Options.
The various Find commands available on the Edit menu can be used directly in the Stdio window.
Select this option to activate or deactivate the Disassembled Code window. The Disassembled Code window (aka., the Assembly window) displays machine code generated by the compiler in assembly language format.
The “Disassemble at Cursor” or “Disassemble at Address” commands from the Inspect menu also activate the Disassembled Code window.
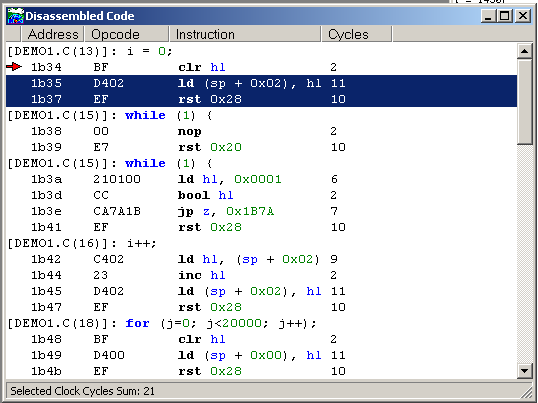
The Disassembled Code window displays Dynamic C statements followed by the assembly instructions for that statement. Each instruction is represented by the memory address on the far left, followed by the opcode bytes, followed by the mnemonics for the instruction. The last column shows the number of cycles for the instruction, assuming no wait states. The total cycle time for a block of instructions will be shown at the lowest row in the block in the cycle-time column, if that block is selected and highlighted with the mouse. The total assumes one execution per instruction, so the user must take looping and branching into consideration when evaluating execution times.
Use the mouse to select several lines in the Assembly window, and the total cycle time for the instructions that were selected will be displayed to the lower right of the selection. If the total includes an asterisk, that means an instruction with an indeterminate cycle time was selected, such as ldir or ret nz.
Right click anywhere in the Disassembled Code window to display the following popup menu:
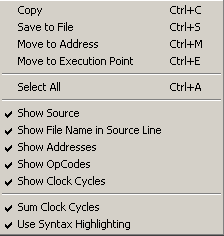
Copies selected text in the Disassembled Code window to the clipboard.
Opens the Save As dialog to save text selected in the Disassembled Code window to a file. If you do not specify an extension, .dasm will be appended to the file name.
Opens the Disassemble at Address dialog so you can enter a new address.
Highlights the assembly instruction that will execute next and displays it in the Disassembled Code window.
Selects all text in the Disassembled Code window.
All but the last menu option of the remaining items in the popup menu toggle what is displayed in the Disassembled Code window. The last menu option, “Use Syntax Highlighting,” displays the colors that were set for the editor window in the Disassembled Code window.
To resize a column in the assembly window, move the mouse pointer to one of the vertical bars that is between each of the column headers. For instance, if you move the mouse pointer between “Address” and “Opcode” the pointer will change from an arrow to a vertical bar with arrows pointing to the right and left. Hold the left mouse button down and drag to the right or left to grow or shrink the column.
Select this option to activate or deactivate the Register window. This window displays the processor register set, including the status register. Letter codes indicate the bits of the status register (also known as the flags register). The window also shows the source-code line and column at which the snapshot of the register was taken.
It is possible to scroll back to see the progression of successive register snapshots. Register values may be changed when program execution is stopped Registers PC, XPC, and SP may not be edited as this can adversely affect program flow and debugging.
See “Register Window” on page 275 for more details on this window.
Select this option to activate or deactivate the Stack window. The Stack window displays the top 32 bytes of the run-time stack. It also shows the line and column at which the stack “snapshot” was taken. It is possible to scroll back to see the progression of successive stack snapshots.
Each time you single step in C or assembly, changed data can be highlighted in the Stack window. (This is also true for the Memory Dump and Register windows.)
The Stack Trace window displays the call sequence and the values of function arguments and local variables of the currently running program. The screenshot shown here is the Stack Trace window when Samples/Demo3.c is running. The window contents tell us that the function main() has been called and that it has one local variable named secs, which currently has a value of 0.
The Depth value along the bottom of the Stack Trace window is the current number of bytes on the stack. The Max Depth value is the maximum number of bytes pushed on the stack at any one time for the current run of the program or since the Max Depth value was reset. The Max Depth value can be reset by a right click in the Stack Trace window to bring up some menu options. Along with resetting the Max Depth value back to zero (think of it like a car trip odometer) you can use the right click menu to copy text from the Stack Trace window or to cause the source code file to become the active window. The source code file could be a library file if a library function is executing at the time the menu option is requested.
Select this option to activate the Information window, which displays how the memory is partitioned and how well the compilation went.
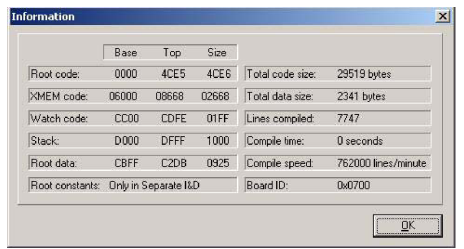
|
Name of Field |
Description of Field |
|
Root code |
The begin (base), end (top) and size of the root code area, expressed in logical address format (16-bit). |
|
XMEM code |
The begin, end and size of the XMEM code area, expressed in physical address format (20-bit). |
|
Watch code |
The begin, end and size of the watch code area, expressed in logical address format (16-bit). |
|
Stack |
The begin, end and size of the run-time stack, expressed in logical address format (16-bit). |
|
Root data |
The begin, end and size of the root data area, expressed in logical address format (16-bit). |
|
Root constants |
The begin, end and size of the root constant area, expressed in physical address format (20-bit). |
|
Total code size |
The number of code bytes (including both root and XMEM code areas. |
|
Total data size |
The number of data bytes (including both root and XMEM data areas |
|
Lines compiled |
The number of lines compiled, including lines from library files. |
|
Compile time |
The number of seconds taken to compile the program. |
|
Compile speed |
Average speed of compilation measured in lines compiled per minute. |
|
Board ID |
A number identifying the board type. A list of board types is at \Lib\default.h. |
Note that some of the memory areas described here may be non-contiguous (e.g., 2 Flash compiles and the XMEM code area with separate I&D). If an application is large enough to span into the non-contiguous part of an area, the values presented in the Information window for that area are not accurate.
Click the menu title or press <Alt+H> to select the HELP menu. The choices are given below:
Opens a browser page and displays a file with links to other manuals. When installing Dynamic C from CD, this menu item points to the hard disk; after a Web upgrade of Dynamic C, this menu item optionally points to the Web.
Displays descriptions for library functions. The keyboard shortcut is <Ctrl+H>.
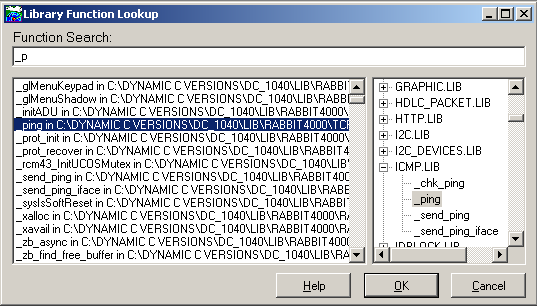
Choosing a function is done in one of several ways. You may type the function name in the Function Search entry box. Notice how both scroll areas underneath the entry box display the first function that matches what you type. The functions to the left are listed alphabetically, while those on the right are arranged in a tree format, displaying the libraries alphabetically with their functions collapsed underneath. You may scroll either of these two areas and have whatever you select in one area reflected in the other area and in the text entry box. Click OK or press <Enter> to bring up the Function Description window.
If the cursor is on a function when Help | Function Lookup is selected (or when <Ctrl+H> is pressed) then the Library Function Lookup dialog is skipped and the Function Description window appears directly.
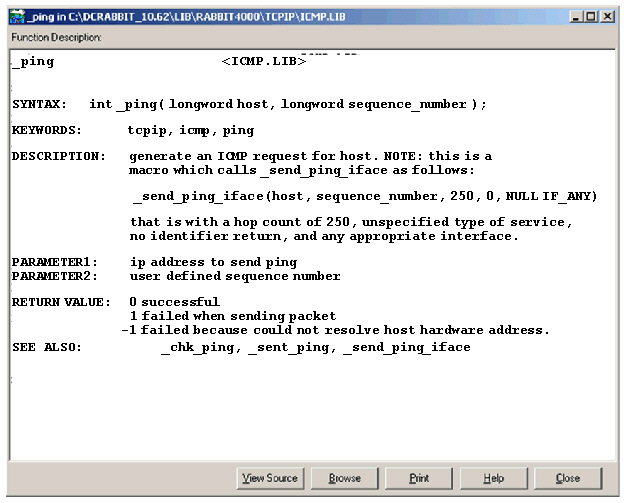
If you click the View Source button, the Function Description window will close and the library that contains the function that was in the window will open in an editor window. The cursor will be placed at the function description of interest.
Clicking on the Browse button will open the Library Function Lookup window to allow you to search for a new function description. Multiple Function Description windows may be open at the same time.
Invokes an on-line help system and displays the alphabetical list of instructions for the Rabbit family of microprocessors.
Invokes an on-line help system that provides the bit values for all of the Rabbit I/O registers.
Invokes an on-line help system and displays the keystrokes page. Although a mouse or other pointing device may be convenient, Dynamic C also supports operation entirely from the keyboard.
Invokes an on-line help system and displays the contents page. From here view explanations of various features of Dynamic C.
Opens a browser window to the Rabbit Technical Support Center web page, which contains links to user forums, downloads for Dynamic C and information about 3rd party software vendors and developers.
Allows you to register your copy of Dynamic C. A dialog is opened for entering your Dynamic C serial number. From there you will be guided through the very quick registration process.
Brings up a window displaying some useful information about Dynamic C. There is an option to scroll to another screen of Dynamic C information and an option to disable the feature. This is the same window that is displayed when Dynamic C initializes.
The About command displays the Dynamic C version number and the registered serial number.
i. The macro STDIO_DEBUG_SERIAL may be defined to redirect Stdio output to a designated serial port, this can be A, B, C or D. For more information, please see the sample program Samples/STDIO_SERIAL.C.
ii. For boards with serial boot flashes, selecting “Flash” is the same as the command line compiler -mfr option.
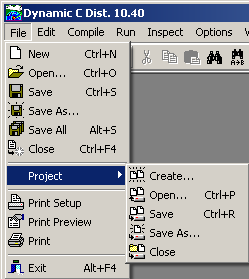 New
New 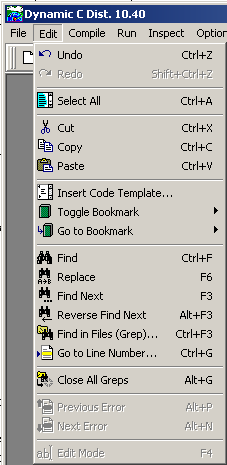 Undo
Undo